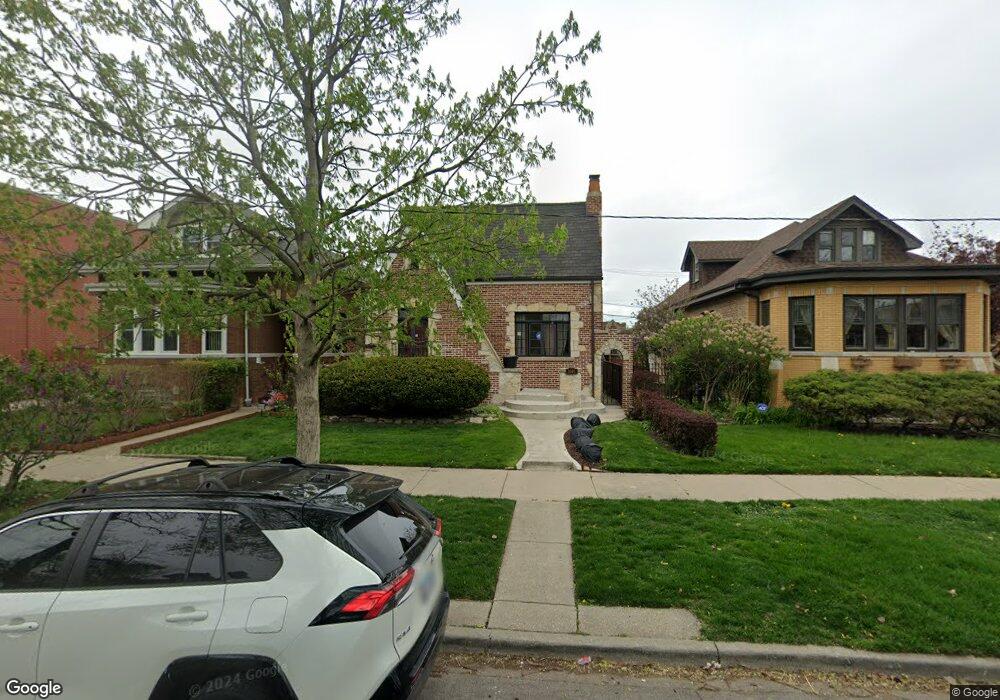
5540 W Pensacola Ave Chicago, IL 60641
Portage Park NeighborhoodEstimated Value: $622,000 - $790,000
4
Beds
3
Baths
2,220
Sq Ft
$305/Sq Ft
Est. Value
About This Home
This home is located at 5540 W Pensacola Ave, Chicago, IL 60641 and is currently estimated at $678,052, approximately $305 per square foot. 5540 W Pensacola Ave is a home located in Cook County with nearby schools including Portage Park Elementary School, Schurz High School, and St. Robert Bellarmine Catholic School.
Ownership History
Date
Name
Owned For
Owner Type
Purchase Details
Closed on
May 22, 2025
Sold by
Conley Kelly M and Conley Danna M
Bought by
Conley Kelly M and Conley Danna M
Current Estimated Value
Purchase Details
Closed on
Apr 23, 2021
Sold by
Conley Kelly M and Conley Kelly
Bought by
Conley Kelly M and Conley Danna M
Home Financials for this Owner
Home Financials are based on the most recent Mortgage that was taken out on this home.
Original Mortgage
$140,000
Interest Rate
2.7%
Mortgage Type
New Conventional
Purchase Details
Closed on
Jun 10, 1996
Sold by
Parkway Bank & Trust Company
Bought by
Conley Kelly M
Home Financials for this Owner
Home Financials are based on the most recent Mortgage that was taken out on this home.
Original Mortgage
$145,600
Interest Rate
7.25%
Create a Home Valuation Report for This Property
The Home Valuation Report is an in-depth analysis detailing your home's value as well as a comparison with similar homes in the area
Home Values in the Area
Average Home Value in this Area
Purchase History
| Date | Buyer | Sale Price | Title Company |
|---|---|---|---|
| Conley Kelly M | -- | None Listed On Document | |
| Conley Kelly M | -- | Citywide Title Corporation | |
| Conley Kelly M | $182,000 | -- |
Source: Public Records
Mortgage History
| Date | Status | Borrower | Loan Amount |
|---|---|---|---|
| Previous Owner | Conley Kelly M | $140,000 | |
| Previous Owner | Conley Kelly M | $145,600 |
Source: Public Records
Tax History Compared to Growth
Tax History
| Year | Tax Paid | Tax Assessment Tax Assessment Total Assessment is a certain percentage of the fair market value that is determined by local assessors to be the total taxable value of land and additions on the property. | Land | Improvement |
|---|---|---|---|---|
| 2024 | $7,326 | $46,136 | $13,125 | $33,011 |
| 2023 | $7,120 | $38,037 | $10,500 | $27,537 |
| 2022 | $7,120 | $38,037 | $10,500 | $27,537 |
| 2021 | $6,979 | $38,036 | $10,500 | $27,536 |
| 2020 | $6,599 | $32,725 | $5,437 | $27,288 |
| 2019 | $6,617 | $36,362 | $5,437 | $30,925 |
| 2018 | $6,504 | $36,362 | $5,437 | $30,925 |
| 2017 | $5,001 | $26,609 | $4,875 | $21,734 |
| 2016 | $5,341 | $29,162 | $4,875 | $24,287 |
| 2015 | $4,863 | $29,162 | $4,875 | $24,287 |
| 2014 | $4,395 | $26,256 | $4,500 | $21,756 |
| 2013 | $4,297 | $26,256 | $4,500 | $21,756 |
Source: Public Records
Map
Nearby Homes
- 5448 W Agatite Ave
- 5704 W Montrose Ave Unit 2B
- 5401 W Montrose Ave
- 5410 W Hutchinson St
- 5354 W Montrose Ave
- 5516 W Windsor Ave Unit 2M
- 5352 W Sunnyside Ave
- 5416 W Windsor Ave Unit 1N
- 5431 W Wilson Ave
- 5253 W Cullom Ave
- 5330 W Windsor Ave Unit 3I
- 4414 N Monitor Ave
- 4256 N Monitor Ave
- 4215 N Lockwood Ave Unit 6
- 4230 N Monitor Ave
- 5221 W Montrose Ave
- 5710 W Leland Ave
- 4025 N Menard Ave
- 5255 W Belle Plaine Ave
- 5142 W Hutchinson St
- 5544 W Pensacola Ave
- 5536 W Pensacola Ave
- 5530 W Pensacola Ave
- 5528 W Pensacola Ave
- 5524 W Pensacola Ave
- 5533 W Montrose Ave
- 5529 W Montrose Ave
- 5541 W Pensacola Ave
- 5537 W Pensacola Ave
- 5545 W Pensacola Ave
- 5535 W Pensacola Ave
- 5520 W Pensacola Ave
- 5531 W Pensacola Ave
- 4323 N Central Ave
- 5529 W Pensacola Ave
- 5523 W Montrose Ave
- 5523 W Montrose Ave
- 5516 W Pensacola Ave
- 5517 W Montrose Ave Unit 5517-19
- 5517 W Montrose Ave Unit 19