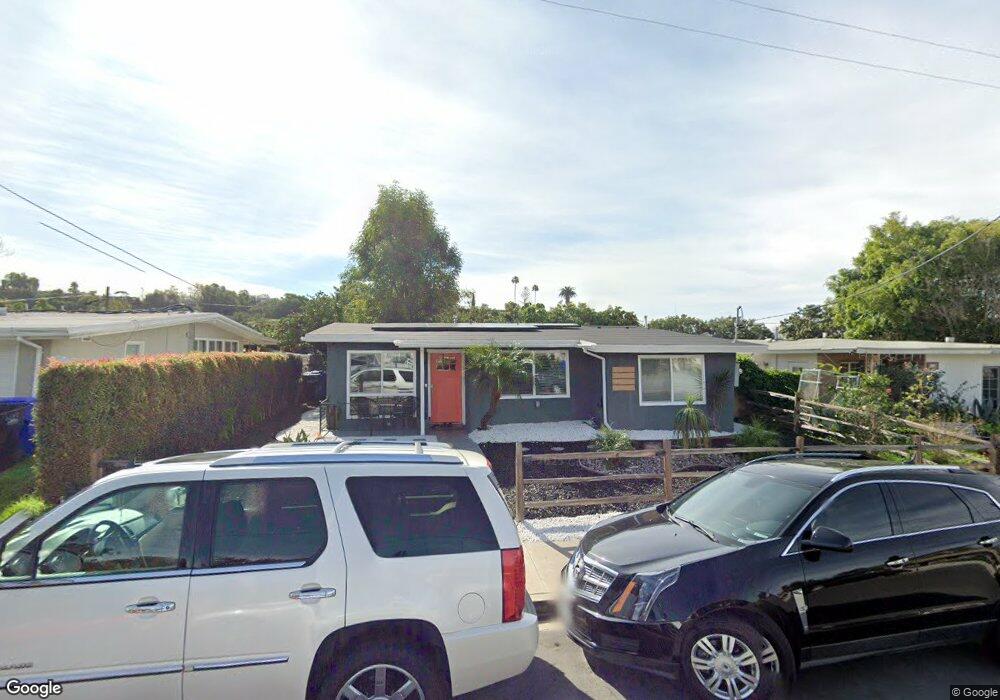
5541 Michael St San Diego, CA 92105
Estimated Value: $699,000 - $799,000
3
Beds
2
Baths
1,044
Sq Ft
$709/Sq Ft
Est. Value
About This Home
This home is located at 5541 Michael St, San Diego, CA 92105 and is currently estimated at $739,727, approximately $708 per square foot. 5541 Michael St is a home located in San Diego County with nearby schools including Carver Elementary School, Mann Middle School, and Crawford High School.
Ownership History
Date
Name
Owned For
Owner Type
Purchase Details
Closed on
Sep 26, 2019
Sold by
Rsk Investments Llc
Bought by
Flores Jose A and Flores Melissa V
Current Estimated Value
Home Financials for this Owner
Home Financials are based on the most recent Mortgage that was taken out on this home.
Original Mortgage
$492,470
Outstanding Balance
$433,610
Interest Rate
3.75%
Mortgage Type
FHA
Estimated Equity
$306,117
Purchase Details
Closed on
May 30, 2019
Sold by
The Bohringer Trust
Bought by
Rsk Investments Llc
Purchase Details
Closed on
Apr 22, 2008
Sold by
Bohringer Troveda
Bought by
Bohringer Troveda and Bohringer Mildred Christine
Purchase Details
Closed on
Sep 22, 1995
Sold by
Bohringer Troveda Romaine
Bought by
Bohringer Joe G and Bohringer Troveda
Purchase Details
Closed on
Mar 17, 1995
Sold by
Bohringer Troveda Romaine
Bought by
Bohringer Joe G and Bohringer Troveda
Create a Home Valuation Report for This Property
The Home Valuation Report is an in-depth analysis detailing your home's value as well as a comparison with similar homes in the area
Purchase History
| Date | Buyer | Sale Price | Title Company |
|---|---|---|---|
| Flores Jose A | $505,000 | First American Title Company | |
| Rsk Investments Llc | $290,000 | First American Title Company | |
| Bohringer Troveda | -- | None Available | |
| Bohringer Joe G | -- | -- | |
| Bohringer Joe G | -- | -- |
Source: Public Records
Mortgage History
| Date | Status | Borrower | Loan Amount |
|---|---|---|---|
| Open | Flores Jose A | $492,470 |
Source: Public Records
Tax History
| Year | Tax Paid | Tax Assessment Tax Assessment Total Assessment is a certain percentage of the fair market value that is determined by local assessors to be the total taxable value of land and additions on the property. | Land | Improvement |
|---|---|---|---|---|
| 2025 | $6,599 | $552,286 | $431,988 | $120,298 |
| 2024 | $6,599 | $541,458 | $423,518 | $117,940 |
| 2023 | $6,451 | $530,842 | $415,214 | $115,628 |
| 2022 | $6,278 | $520,434 | $407,073 | $113,361 |
| 2021 | $6,234 | $510,231 | $399,092 | $111,139 |
| 2020 | $6,157 | $505,000 | $395,000 | $110,000 |
| 2019 | $612 | $54,004 | $22,553 | $31,451 |
| 2018 | $572 | $52,946 | $22,111 | $30,835 |
| 2017 | $557 | $51,909 | $21,678 | $30,231 |
| 2016 | $545 | $50,892 | $21,253 | $29,639 |
| 2015 | $536 | $50,128 | $20,934 | $29,194 |
| 2014 | $527 | $49,147 | $20,524 | $28,623 |
Source: Public Records
Map
Nearby Homes
- 5474 Streamview Dr
- 3251 Winlow St
- 3214 Winlow St
- 5810 Redwood St
- 0 Chollas Station Rd
- 5502 University Ave
- 3980 Faircross Place Unit 17
- 3980 Faircross Place Unit 25
- 3980 Faircross Place Unit 36
- 3631 Lemona Ave Unit C
- 5310 Rex Ave Unit 3
- 2959 54th St
- 3626 Lemona Ave Unit A
- 3595 51st St
- 3930 60th St Unit 171
- 4062 Union Square Ln Unit 205
- 5427 Soho View Terrace
- 4096 Union Square Ln
- 5980 Dandridge Ln Unit 215
- 5990 Dandridge Ln Unit 177
- 5547 Michael St
- 5535 Michael St
- 5542 Streamview Dr
- 5529 Michael St
- 5555 Michael St
- 5548 Streamview Dr
- 5536 Streamview Dr
- 5530 Streamview Dr
- 5554 Streamview Dr
- 5542 Michael St
- 5523 Michael St
- 5561 Michael St
- 5548 Michael St
- 5536 Michael St
- 5530 Michael St
- 5554 Michael St
- 5524 Streamview Dr
- 5560 Streamview Dr
- 5567 Michael St
- 5517 Michael St
Your Personal Tour Guide
Ask me questions while you tour the home.