5543 Nanday Ct Unit 3 Oceanside, CA 92057
North Valley NeighborhoodEstimated Value: $1,041,796 - $1,140,000
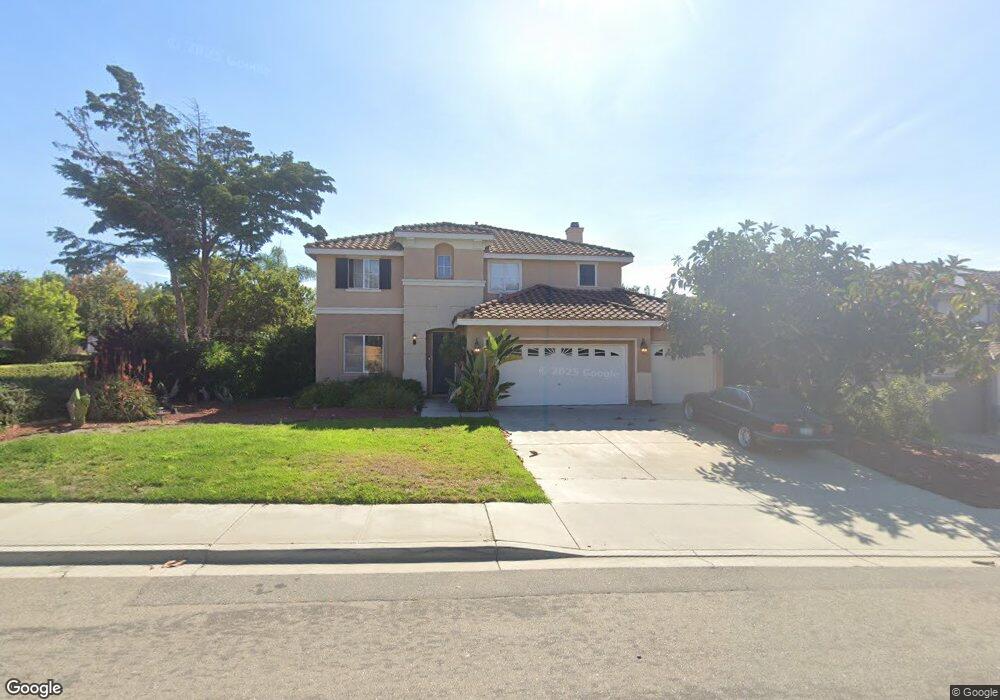
About This Home
This home is located at 5543 Nanday Ct Unit 3, Oceanside, CA 92057 and is currently estimated at $1,094,949, approximately $381 per square foot. 5543 Nanday Ct Unit 3 is a home located in San Diego County with nearby schools including Bonsall West Elementary School, Sullivan Middle School, and Bonsall High.
Ownership History
We collect this data history from publicly available records. To have your information removed, we recommend requesting removal directly through your county’s website.
Purchase Details
Home Financials for this Owner
Home Financials are based on the most recent Mortgage that was taken out on this home.Purchase Details
Home Financials for this Owner
Home Financials are based on the most recent Mortgage that was taken out on this home.Home Values in the Area
Average Home Value in this Area
Purchase History
We collect this data history from publicly available records. To have your information removed, we recommend requesting removal directly through your county’s website.
| Date | Buyer | Sale Price | Title Company |
|---|---|---|---|
| -- | Boston National Title Agency | ||
| $386,500 | First American Title |
Mortgage History
We collect this data history from publicly available records. To have your information removed, we recommend requesting removal directly through your county’s website.
| Date | Status | Borrower | Loan Amount |
|---|---|---|---|
| Open | $383,500 | ||
| Previous Owner | $311,250 | ||
| Closed | $74,900 |
Tax History
We collect this data history from publicly available records. To have your information removed, we recommend requesting removal directly through your county’s website.
| Year | Tax Paid | Tax Assessment Tax Assessment Total Assessment is a certain percentage of the fair market value that is determined by local assessors to be the total taxable value of land and additions on the property. | Land | Improvement |
|---|---|---|---|---|
| 2025 | $5,830 | $559,305 | $246,207 | $313,098 |
| 2024 | $5,830 | $548,339 | $241,380 | $306,959 |
| 2023 | $5,701 | $537,589 | $236,648 | $300,941 |
| 2022 | $5,529 | $527,049 | $232,008 | $295,041 |
| 2021 | $5,427 | $516,715 | $227,459 | $289,256 |
| 2020 | $5,383 | $511,418 | $225,127 | $286,291 |
| 2019 | $5,281 | $501,391 | $220,713 | $280,678 |
| 2018 | $5,305 | $491,561 | $216,386 | $275,175 |
| 2017 | $70 | $481,924 | $212,144 | $269,780 |
| 2016 | $5,076 | $472,476 | $207,985 | $264,491 |
| 2015 | $4,996 | $465,380 | $204,861 | $260,519 |
| 2014 | $4,828 | $450,000 | $198,000 | $252,000 |
Map
- 5530 Papagallo Dr
- 5544 Papagallo Dr
- 1022 Straightaway Ct
- 5450 Alexandrine Ct
- 5414 Toucanet Ct
- 1025 Boulder Place
- 1093 Breakaway Dr
- 1080 Breakaway Dr
- 5177 Bluegrass Way
- 1077 Village Dr
- 1018 Bellingham Dr
- 5229 Harvest Ct
- 5125 Eliot St
- 1491 Puritan Way
- 1486 Puritan Dr
- 980 Manteca Dr
- 1268 Bellingham Dr
- 5022 Calle Arquero
- 795 Via Callado
- 5179 Via Mindanao
- 5539 Nanday Ct
- 5539 Nanday Ct Unit 3
- 5519 Papagallo Dr
- 5526 Nanday Ct
- 5535 Nanday Ct Unit 3
- 5522 Nanday Ct
- 5523 Papagallo Dr
- 5547 Nanday Ct
- 3504 Cockatoo Ct
- 5528 Nanday Ct
- 5531 Nanday Ct
- 5527 Papagallo Dr
- 5549 Nanday Ct
- 5518 Nanday Ct
- 3508 Cockatoo Ct
- 5532 Nanday Ct
- 5530 Nanday Ct
- 5515 Papagallo Dr
- 5527 Nanday Ct
- 5551 Nanday Ct
Ask me questions while you tour the home.