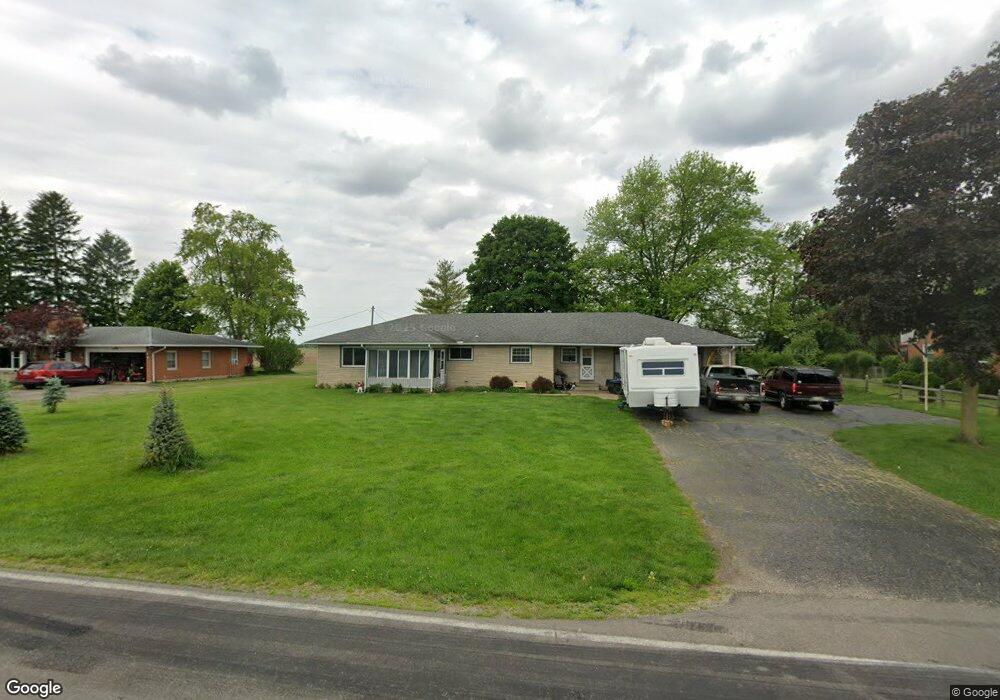
5544 N Rangeline Rd Covington, OH 45318
Estimated Value: $222,000 - $270,000
4
Beds
2
Baths
1,705
Sq Ft
$145/Sq Ft
Est. Value
About This Home
This home is located at 5544 N Rangeline Rd, Covington, OH 45318 and is currently estimated at $247,817, approximately $145 per square foot. 5544 N Rangeline Rd is a home located in Miami County with nearby schools including Covington Elementary/Junior High School, Covington Junior High School, and Covington High School.
Ownership History
Date
Name
Owned For
Owner Type
Purchase Details
Closed on
May 13, 2021
Sold by
Dwain Laughman John
Bought by
Hoblit Damita J
Current Estimated Value
Purchase Details
Closed on
May 4, 2021
Sold by
Dwain Laughman John
Bought by
Hoblit Damita J
Purchase Details
Closed on
Mar 10, 2016
Sold by
Feight Dustin Michael and Feight Alexander
Bought by
Laughman John D
Purchase Details
Closed on
Oct 26, 2011
Sold by
Warner Carl L
Bought by
Feight Dustin Michael
Purchase Details
Closed on
Jan 1, 1990
Bought by
Warner Carl L
Create a Home Valuation Report for This Property
The Home Valuation Report is an in-depth analysis detailing your home's value as well as a comparison with similar homes in the area
Purchase History
| Date | Buyer | Sale Price | Title Company |
|---|---|---|---|
| Hoblit Damita J | -- | -- | |
| Hoblit Damita J | -- | -- | |
| Laughman John D | $105,500 | Attorney | |
| Feight Dustin Michael | $103,000 | -- | |
| Warner Carl L | -- | -- |
Source: Public Records
Mortgage History
| Date | Status | Borrower | Loan Amount |
|---|---|---|---|
| Closed | Feight Dustin Michael | -- |
Source: Public Records
Tax History
| Year | Tax Paid | Tax Assessment Tax Assessment Total Assessment is a certain percentage of the fair market value that is determined by local assessors to be the total taxable value of land and additions on the property. | Land | Improvement |
|---|---|---|---|---|
| 2024 | $2,337 | $58,810 | $8,440 | $50,370 |
| 2023 | $2,030 | $58,810 | $8,440 | $50,370 |
| 2022 | $1,987 | $58,810 | $8,440 | $50,370 |
| 2021 | $1,675 | $45,230 | $6,480 | $38,750 |
| 2020 | $1,679 | $45,230 | $6,480 | $38,750 |
| 2019 | $1,743 | $45,230 | $6,480 | $38,750 |
| 2018 | $1,464 | $40,150 | $5,920 | $34,230 |
| 2017 | $1,493 | $40,150 | $5,920 | $34,230 |
| 2016 | $1,398 | $40,150 | $5,920 | $34,230 |
| 2015 | $1,406 | $37,880 | $5,570 | $32,310 |
| 2014 | $1,406 | $37,880 | $5,570 | $32,310 |
| 2013 | $1,333 | $37,880 | $5,570 | $32,310 |
Source: Public Records
Map
Nearby Homes
- 5522 N Rangeline Rd
- 5570 N Rangeline Rd
- 5600 N Rangeline Rd
- 5474 N Rangeline Rd
- 5622 N Rangeline Rd
- 5471 N Rangeline Rd
- 5440 N Rangeline Rd
- 9020 W Us Route 36
- 5425 N Rangeline Rd
- 9066 W Us Route 36
- 5665 N Rangeline Rd
- 5390 N Rangeline Rd
- 8930 W Us Route 36
- 9090 W Us Route 36
- 9128 W Us Route 36
- 5381 N Rangeline Rd
- 9144 W Us Route 36
- 9075 W Us Route 36
- 8965 W Us Route 36
- 9170 W Us Route 36
Your Personal Tour Guide
Ask me questions while you tour the home.