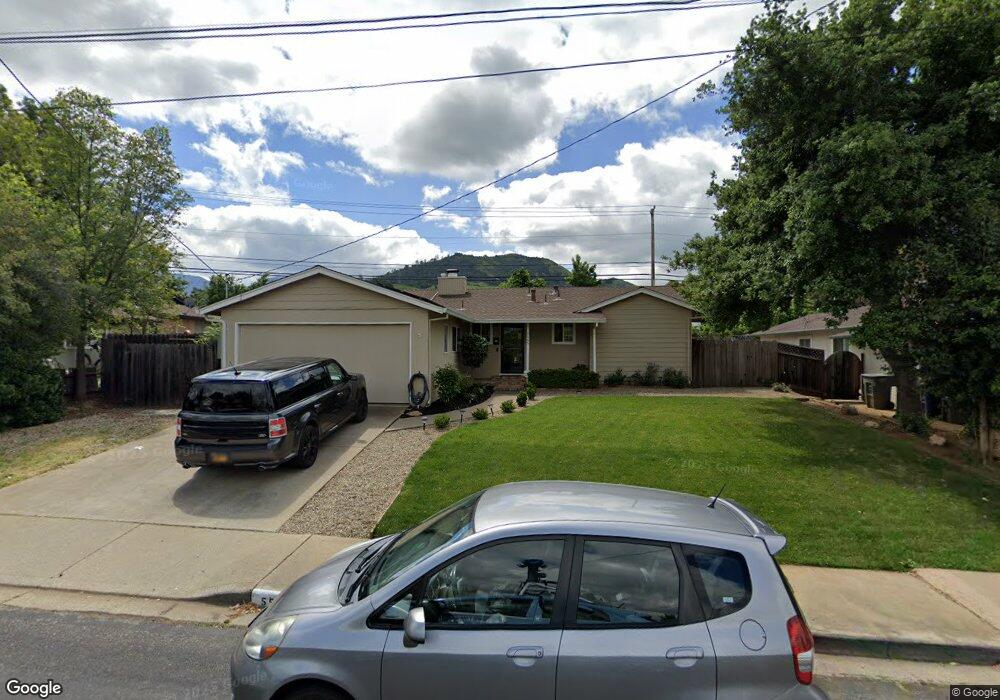
5545 Alabama Dr Concord, CA 94521
The Highlands NeighborhoodEstimated Value: $701,000 - $779,000
3
Beds
2
Baths
1,200
Sq Ft
$606/Sq Ft
Est. Value
About This Home
This home is located at 5545 Alabama Dr, Concord, CA 94521 and is currently estimated at $727,488, approximately $606 per square foot. 5545 Alabama Dr is a home located in Contra Costa County with nearby schools including Highlands Elementary School, Mt. Diablo Elementary School, and Pine Hollow Middle School.
Ownership History
Date
Name
Owned For
Owner Type
Purchase Details
Closed on
May 22, 2009
Sold by
Price Sherri J
Bought by
Morehouse Sarah
Current Estimated Value
Home Financials for this Owner
Home Financials are based on the most recent Mortgage that was taken out on this home.
Original Mortgage
$209,940
Outstanding Balance
$132,430
Interest Rate
4.82%
Mortgage Type
Purchase Money Mortgage
Estimated Equity
$595,058
Purchase Details
Closed on
May 14, 1998
Sold by
Adams Dean D and Adams Janelle D
Bought by
Price Sherri J
Home Financials for this Owner
Home Financials are based on the most recent Mortgage that was taken out on this home.
Original Mortgage
$177,500
Interest Rate
7.07%
Mortgage Type
Purchase Money Mortgage
Create a Home Valuation Report for This Property
The Home Valuation Report is an in-depth analysis detailing your home's value as well as a comparison with similar homes in the area
Home Values in the Area
Average Home Value in this Area
Purchase History
| Date | Buyer | Sale Price | Title Company |
|---|---|---|---|
| Morehouse Sarah | $352,000 | North American Title Company | |
| Price Sherri J | $177,500 | Old Republic Title Company |
Source: Public Records
Mortgage History
| Date | Status | Borrower | Loan Amount |
|---|---|---|---|
| Open | Morehouse Sarah | $209,940 | |
| Previous Owner | Price Sherri J | $177,500 |
Source: Public Records
Tax History
| Year | Tax Paid | Tax Assessment Tax Assessment Total Assessment is a certain percentage of the fair market value that is determined by local assessors to be the total taxable value of land and additions on the property. | Land | Improvement |
|---|---|---|---|---|
| 2025 | $9,505 | $453,275 | $318,068 | $135,207 |
| 2024 | $9,228 | $444,388 | $311,832 | $132,556 |
| 2023 | $9,228 | $435,675 | $305,718 | $129,957 |
| 2022 | $9,144 | $427,133 | $299,724 | $127,409 |
| 2021 | $8,999 | $418,759 | $293,848 | $124,911 |
| 2019 | $8,844 | $406,340 | $285,133 | $121,207 |
| 2018 | $8,631 | $398,374 | $279,543 | $118,831 |
| 2017 | $8,434 | $390,563 | $274,062 | $116,501 |
| 2016 | $4,868 | $382,906 | $268,689 | $114,217 |
| 2015 | $4,804 | $377,156 | $264,654 | $112,502 |
| 2014 | $4,445 | $346,000 | $242,791 | $103,209 |
Source: Public Records
Map
Nearby Homes
- 5549 Alabama Dr
- 5549 Pennsylvania Blvd
- 5510 Alaska Dr
- 5492 Roundtree Dr Unit A
- 1271 Kentucky Dr
- 50 Nottingham Place
- 5451 Roundtree Place
- 5434 Roundtree Ct Unit A
- 1120 Kenwal Rd Unit C
- 1160 Kenwal Rd Unit D
- 5817 Mitchell Canyon Ct
- 1395 Kenwal Rd Unit A
- 5333 Park Highlands Blvd Unit 27
- 5308 Vista Point Ct
- 1505 Kirker Pass Rd Unit 122
- 1505 Kirker Pass Rd Unit 170
- 5460 Concord Blvd Unit E4
- 1640 Allegro Ave
- 5895 Herriman Dr
- 1109 Discovery Way
- 5547 Alabama Dr
- 5543 Alabama Dr
- 5541 Alabama Dr
- 5548 Alabama Dr
- 5544 Alabama Dr
- 5550 Alabama Dr
- 5542 Alabama Dr
- 5551 Alabama Dr
- 5539 Alabama Dr
- 1333 Vermont Ave
- 5552 Alabama Dr
- 1334 Vermont Ave
- 5540 Alabama Dr
- 5553 Alabama Dr
- 5537 Alabama Dr
- 1329 Pennsylvania Blvd
- 1336 Vermont Ave
- 1335 Vermont Ave
- 5506 Pine Hollow Rd
- 1338 Montana Dr