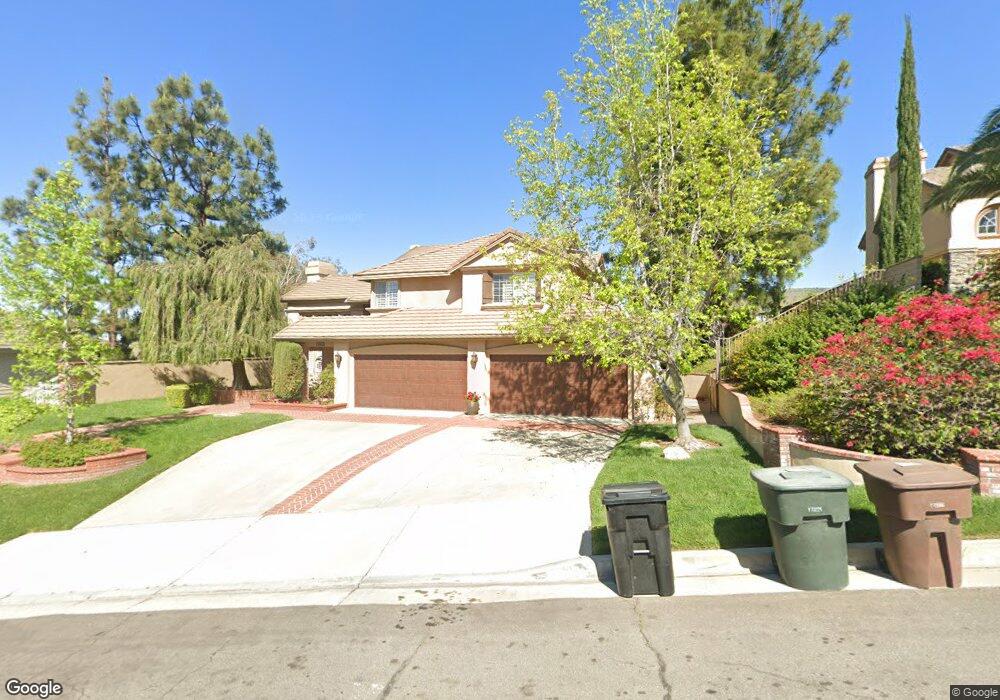
5545 Camino de Bryant Yorba Linda, CA 92887
Estimated Value: $2,347,000 - $2,645,000
4
Beds
4
Baths
3,505
Sq Ft
$695/Sq Ft
Est. Value
About This Home
This home is located at 5545 Camino de Bryant, Yorba Linda, CA 92887 and is currently estimated at $2,435,629, approximately $694 per square foot. 5545 Camino de Bryant is a home located in Orange County with nearby schools including Bryant Ranch Elementary School, Travis Ranch Middle School, and Yorba Linda High School.
Ownership History
Date
Name
Owned For
Owner Type
Purchase Details
Closed on
Apr 20, 2000
Sold by
James Stutz and James Martha
Bought by
Elie Gayle O and Elie Christine F
Current Estimated Value
Home Financials for this Owner
Home Financials are based on the most recent Mortgage that was taken out on this home.
Original Mortgage
$519,750
Outstanding Balance
$133,144
Interest Rate
4.7%
Estimated Equity
$2,302,485
Purchase Details
Closed on
Feb 14, 2000
Sold by
James Stutz and James Martha
Bought by
Stutz James E
Purchase Details
Closed on
Jun 20, 1999
Sold by
James Stutz and James Martha
Bought by
Stutz James E and Stutz Martha
Purchase Details
Closed on
Jun 1, 1994
Sold by
Cornell Brian and Cornell Martha
Bought by
Stutz James E and Stutz Martha
Home Financials for this Owner
Home Financials are based on the most recent Mortgage that was taken out on this home.
Original Mortgage
$360,500
Interest Rate
8.8%
Create a Home Valuation Report for This Property
The Home Valuation Report is an in-depth analysis detailing your home's value as well as a comparison with similar homes in the area
Home Values in the Area
Average Home Value in this Area
Purchase History
| Date | Buyer | Sale Price | Title Company |
|---|---|---|---|
| Elie Gayle O | $693,000 | Gateway Title Company | |
| Stutz James E | -- | Gateway Title Company | |
| Stutz James E | -- | -- | |
| Stutz James E | $515,000 | Chicago Title Company |
Source: Public Records
Mortgage History
| Date | Status | Borrower | Loan Amount |
|---|---|---|---|
| Open | Elie Gayle O | $519,750 | |
| Previous Owner | Stutz James E | $360,500 |
Source: Public Records
Tax History Compared to Growth
Tax History
| Year | Tax Paid | Tax Assessment Tax Assessment Total Assessment is a certain percentage of the fair market value that is determined by local assessors to be the total taxable value of land and additions on the property. | Land | Improvement |
|---|---|---|---|---|
| 2025 | $13,593 | $1,065,120 | $554,344 | $510,776 |
| 2024 | $13,593 | $1,044,236 | $543,475 | $500,761 |
| 2023 | $12,266 | $1,023,761 | $532,818 | $490,943 |
| 2022 | $12,110 | $1,003,688 | $522,371 | $481,317 |
| 2021 | $11,875 | $984,008 | $512,128 | $471,880 |
| 2020 | $11,772 | $973,919 | $506,877 | $467,042 |
| 2019 | $11,362 | $954,823 | $496,938 | $457,885 |
| 2018 | $11,227 | $936,101 | $487,194 | $448,907 |
| 2017 | $11,034 | $917,747 | $477,642 | $440,105 |
| 2016 | $10,418 | $899,752 | $468,276 | $431,476 |
| 2015 | $10,318 | $886,237 | $461,242 | $424,995 |
| 2014 | $10,024 | $868,877 | $452,207 | $416,670 |
Source: Public Records
Map
Nearby Homes
- 27025 Glaramara Ln
- 5425 Castle Bend Way
- 27055 Big Horn Mountain Way
- 5527 Patricia Way
- 23985 Nicole Way Unit 31
- 5420 Los Monteros
- 27870 Tamara Dr
- 27170 Big Horn Mountain Way
- 0 Meadow Land Dr
- 5150 Avenida de Despacio
- 23964 Old Pomegranate Rd
- 24370 La Homa
- 25511 Palermo Way
- 1322 Edna St
- 5917 San Remo Way
- 25540 Aragon Way
- 25633 Corsica Way
- 5370 Silver Canyon Rd Unit 7E
- 23080 Foxtail Dr
- 23556 Cambridge Rd Unit 327
- 5535 Camino de Bryant
- 5555 Camino de Bryant
- 5550 Camino de Bryant
- 5525 Camino de Bryant
- 5565 Camino de Bryant
- 5560 Camino de Bryant
- 5540 Camino de Bryant
- 5570 Camino de Bryant
- 5515 Camino de Bryant
- 5575 Camino de Bryant
- 5580 Camino de Bryant
- 5530 Camino de Bryant
- 5505 Camino de Bryant
- 5585 Camino de Bryant
- 27005 Maiden Moor Ln
- 5520 Camino de Bryant
- 26980 Applecross Ln
- 5595 Camino de Bryant
- 27025 Maiden Moor Ln
- 26990 Applecross Ln