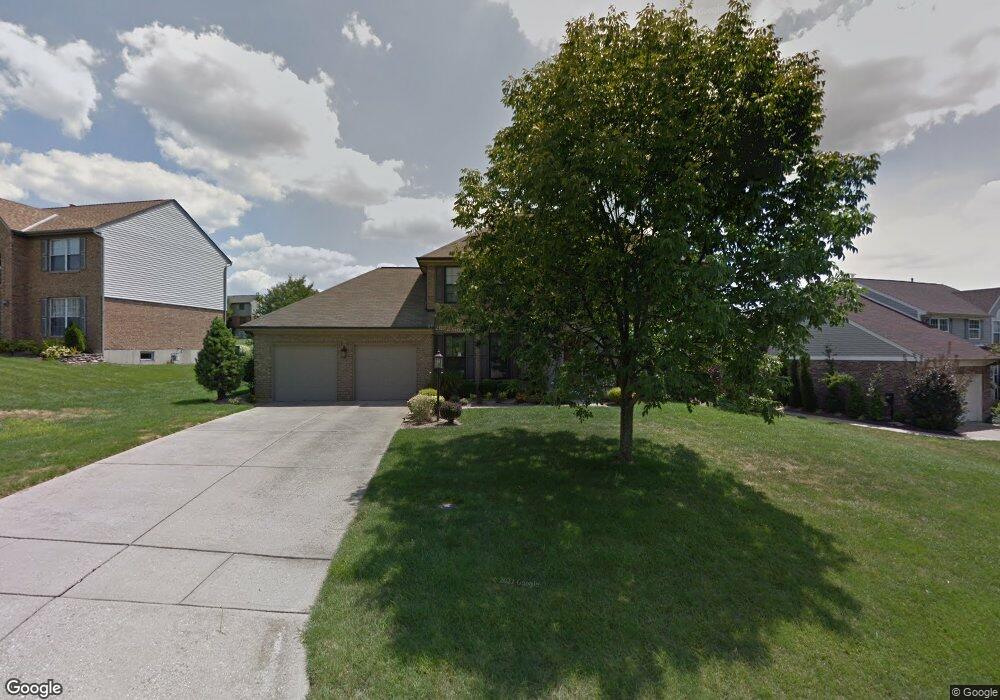
5545 Deervalley Ct Cincinnati, OH 45247
Estimated Value: $390,000 - $432,000
4
Beds
3
Baths
2,116
Sq Ft
$196/Sq Ft
Est. Value
About This Home
This home is located at 5545 Deervalley Ct, Cincinnati, OH 45247 and is currently estimated at $413,987, approximately $195 per square foot. 5545 Deervalley Ct is a home located in Hamilton County with nearby schools including Colerain Elementary School, Colerain Middle School, and Colerain High School.
Ownership History
Date
Name
Owned For
Owner Type
Purchase Details
Closed on
Nov 22, 2021
Sold by
Hufford Terry A and Hufford Joan C
Bought by
Greene Lauren
Current Estimated Value
Home Financials for this Owner
Home Financials are based on the most recent Mortgage that was taken out on this home.
Original Mortgage
$250,000
Outstanding Balance
$229,398
Interest Rate
3.09%
Mortgage Type
New Conventional
Estimated Equity
$184,589
Purchase Details
Closed on
Nov 11, 2020
Sold by
Bradshaw Carrie
Bought by
Hufford Terry A and Hufford Joan C
Purchase Details
Closed on
May 30, 2018
Sold by
Floyd Daniel W and Floyd Susan H
Bought by
Hufford Terry A and Hufford Joan C
Home Financials for this Owner
Home Financials are based on the most recent Mortgage that was taken out on this home.
Original Mortgage
$115,000
Interest Rate
4.5%
Mortgage Type
New Conventional
Purchase Details
Closed on
Nov 24, 2003
Sold by
Hoffman William M and Hoffman Nancy C
Bought by
Floyd Daniel W and Floyd Susan N
Home Financials for this Owner
Home Financials are based on the most recent Mortgage that was taken out on this home.
Original Mortgage
$210,000
Interest Rate
4.5%
Mortgage Type
Unknown
Create a Home Valuation Report for This Property
The Home Valuation Report is an in-depth analysis detailing your home's value as well as a comparison with similar homes in the area
Home Values in the Area
Average Home Value in this Area
Purchase History
| Date | Buyer | Sale Price | Title Company |
|---|---|---|---|
| Greene Lauren | $350,000 | Parkway Title Llc | |
| Hufford Terry A | -- | None Available | |
| Hufford Terry A | $241,000 | None Available | |
| Floyd Daniel W | -- | -- |
Source: Public Records
Mortgage History
| Date | Status | Borrower | Loan Amount |
|---|---|---|---|
| Open | Greene Lauren | $250,000 | |
| Previous Owner | Hufford Terry A | $115,000 | |
| Previous Owner | Floyd Daniel W | $210,000 |
Source: Public Records
Tax History Compared to Growth
Tax History
| Year | Tax Paid | Tax Assessment Tax Assessment Total Assessment is a certain percentage of the fair market value that is determined by local assessors to be the total taxable value of land and additions on the property. | Land | Improvement |
|---|---|---|---|---|
| 2024 | $6,535 | $122,500 | $20,125 | $102,375 |
| 2023 | $6,575 | $122,500 | $20,125 | $102,375 |
| 2022 | $5,551 | $84,350 | $18,032 | $66,318 |
| 2021 | $5,503 | $84,350 | $18,032 | $66,318 |
| 2020 | $5,561 | $84,350 | $18,032 | $66,318 |
| 2019 | $4,777 | $67,617 | $16,100 | $51,517 |
| 2018 | $3,726 | $67,617 | $16,100 | $51,517 |
| 2017 | $3,523 | $67,617 | $16,100 | $51,517 |
| 2016 | $3,740 | $70,543 | $16,422 | $54,121 |
| 2015 | $3,785 | $70,543 | $16,422 | $54,121 |
| 2014 | $3,792 | $70,543 | $16,422 | $54,121 |
| 2013 | $3,528 | $69,160 | $16,100 | $53,060 |
Source: Public Records
Map
Nearby Homes
- 5410 Desertgold Dr
- 8211 Fawn Lake Ct
- 4893 Blue Meadow Ln
- 5658 Springdale Rd
- 5778 Blue Rock Hill Rd
- 0 Thompson Rd Unit 1833173
- 6080 Thompson Rd
- 5591 Squirrel Run
- 8713 Wuest Rd
- 6087 Magnolia Woods Way
- 6983 Daybreak Dr
- 4527 Hanley Rd
- 3960 Olde Savannah Dr
- 3950 Olde Savannah Dr
- 8530 Wuest Rd
- 4538 Philnoll Dr
- 8244 Spring Leaf Lake Dr
- 4029 Appletree Ct
- 6129 Rose Petal Dr
- 4151 Poole Rd
- 5555 Deervalley Ct
- 5533 Deervalley Ct
- 5525 Deervalley Ct
- 5563 Deervalley Ct
- 5540 Deervalley Ct
- 5468 Deerlake Ct
- 5534 Deervalley Ct
- 5474 Deerlake Ct
- 5462 Deerlake Ct
- 5517 Deervalley Ct
- 5548 Deervalley Ct
- 5554 Deervalley Ct
- 5526 Deervalley Ct
- 5571 Deervalley Ct
- 5560 Deervalley Ct
- 5482 Deerlake Ct
- 5454 Deerlake Ct
- 8277 Lakevalley Dr
- 5566 Deervalley Ct
- 5570 Deervalley Ct