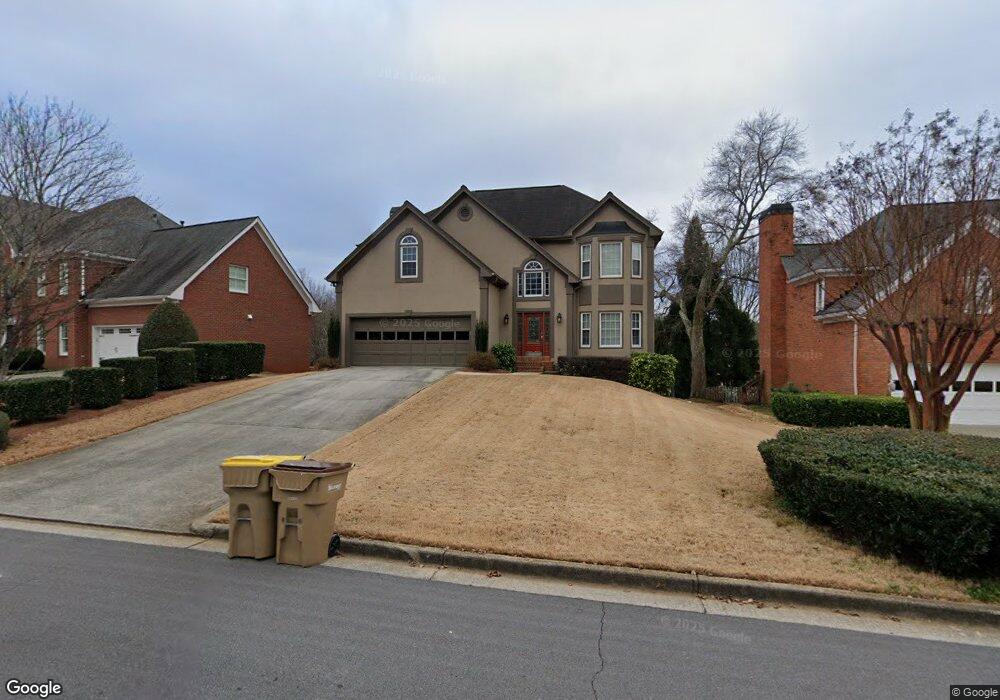
5545 Vicarage Walk Unit III Alpharetta, GA 30005
Windward NeighborhoodEstimated Value: $611,683 - $696,000
5
Beds
3
Baths
2,276
Sq Ft
$283/Sq Ft
Est. Value
About This Home
This home is located at 5545 Vicarage Walk Unit III, Alpharetta, GA 30005 and is currently estimated at $644,421, approximately $283 per square foot. 5545 Vicarage Walk Unit III is a home located in Fulton County with nearby schools including Lake Windward Elementary School, Taylor Road Middle School, and Chattahoochee High School.
Ownership History
Date
Name
Owned For
Owner Type
Purchase Details
Closed on
Oct 31, 2016
Sold by
Pernell
Bought by
Motley Pernell and Motley Splendora R
Current Estimated Value
Purchase Details
Closed on
Nov 29, 2000
Sold by
Assoc Home Equity Svc Inc
Bought by
Motley Pernell and Motley Splendor R
Home Financials for this Owner
Home Financials are based on the most recent Mortgage that was taken out on this home.
Original Mortgage
$168,000
Interest Rate
7.72%
Mortgage Type
New Conventional
Purchase Details
Closed on
Mar 13, 1996
Sold by
J M Bldrs Inc
Bought by
Skelton Tricia
Create a Home Valuation Report for This Property
The Home Valuation Report is an in-depth analysis detailing your home's value as well as a comparison with similar homes in the area
Home Values in the Area
Average Home Value in this Area
Purchase History
| Date | Buyer | Sale Price | Title Company |
|---|---|---|---|
| Motley Pernell | -- | -- | |
| Motley Pernell | $210,000 | -- | |
| Skelton Tricia | $194,900 | -- |
Source: Public Records
Mortgage History
| Date | Status | Borrower | Loan Amount |
|---|---|---|---|
| Previous Owner | Motley Pernell | $168,000 | |
| Closed | Skelton Tricia | $0 |
Source: Public Records
Tax History Compared to Growth
Tax History
| Year | Tax Paid | Tax Assessment Tax Assessment Total Assessment is a certain percentage of the fair market value that is determined by local assessors to be the total taxable value of land and additions on the property. | Land | Improvement |
|---|---|---|---|---|
| 2025 | $3,116 | $202,000 | $62,680 | $139,320 |
| 2023 | $5,494 | $194,640 | $57,640 | $137,000 |
| 2022 | $3,359 | $144,600 | $42,800 | $101,800 |
| 2021 | $3,319 | $118,000 | $28,920 | $89,080 |
| 2020 | $3,347 | $126,520 | $14,520 | $112,000 |
| 2019 | $400 | $124,240 | $14,240 | $110,000 |
| 2018 | $3,444 | $121,360 | $13,920 | $107,440 |
| 2017 | $3,299 | $109,400 | $32,160 | $77,240 |
| 2016 | $3,228 | $109,400 | $32,160 | $77,240 |
| 2015 | $3,262 | $109,400 | $32,160 | $77,240 |
| 2014 | $2,979 | $97,520 | $28,640 | $68,880 |
Source: Public Records
Map
Nearby Homes
- 5510 Vicarage Walk
- 5440 Vicarage Walk
- 5635 Ashewoode Downs Dr
- 640 Evening Pine Ln
- 140 Ashewoode Downs Ln
- 12470 Concord Hall Dr
- 680 Evening Pine Ln
- 5370 McGinnis Ferry Rd
- 12595 Huntington Trace
- 5650 Preserve Cir
- 5735 Sunset Maple Dr
- 2485 Hamptons Passage
- 3180 Caney Creek Ln
- 1250 Rosewood Dr
- 3055 Rocky Brook Dr
- 12205 Stevens Creek Dr
- 5555 Vicarage Walk Unit 3
- 5535 Vicarage Walk Unit 3
- 145 Vicarage Ct
- 5525 Vicarage Walk
- 5565 Vicarage Walk Unit 2
- 5560 Vicarage Walk
- 155 Vicarage Ct
- 5515 Vicarage Walk
- 135 Vicarage Ct
- 5580 Vicarage Walk Unit III
- 5505 Vicarage Walk Unit 3
- 12615 Oxfordshire Ct
- 12615 Oxfordshire Ct
- 125 Vicarage Ct Unit 2
- 165 Vicarage Ct Unit 2
- 115 Vicarage Ct
- 105 Vicarage Ct Unit 2
- 105 Vicarage Ct
- 105 Vicarage Ct Unit 20
- 12634 Cornish Walk