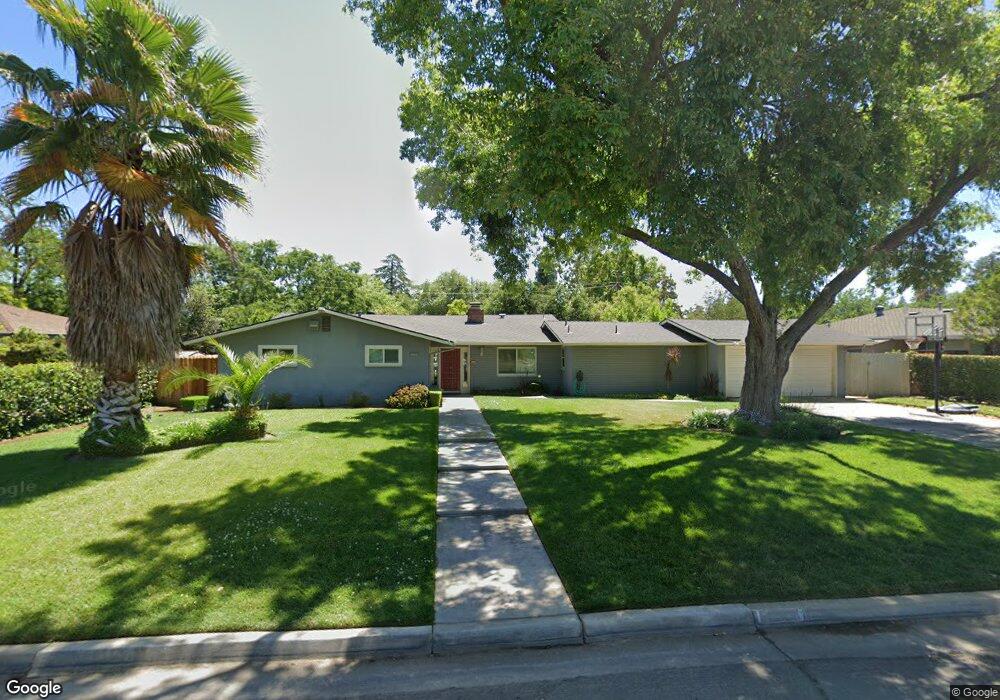
5546 N Colonial Ave Fresno, CA 93704
Bullard NeighborhoodEstimated Value: $584,000 - $681,000
4
Beds
3
Baths
2,636
Sq Ft
$239/Sq Ft
Est. Value
About This Home
This home is located at 5546 N Colonial Ave, Fresno, CA 93704 and is currently estimated at $630,923, approximately $239 per square foot. 5546 N Colonial Ave is a home located in Fresno County with nearby schools including Kratt Elementary School, Tenaya Middle School, and Bullard High School.
Ownership History
Date
Name
Owned For
Owner Type
Purchase Details
Closed on
Jun 18, 2008
Sold by
Reyna Elvia
Bought by
Oppliger Trevor Z and Oppliger Elin M
Current Estimated Value
Home Financials for this Owner
Home Financials are based on the most recent Mortgage that was taken out on this home.
Original Mortgage
$288,000
Outstanding Balance
$184,336
Interest Rate
6%
Mortgage Type
Purchase Money Mortgage
Estimated Equity
$446,587
Purchase Details
Closed on
Apr 16, 2002
Sold by
Goldman Elizabeth
Bought by
Reyna Elvia
Home Financials for this Owner
Home Financials are based on the most recent Mortgage that was taken out on this home.
Original Mortgage
$159,920
Interest Rate
6.89%
Purchase Details
Closed on
Jan 12, 1999
Sold by
Goldman Elizabeth D
Bought by
Goldman Elizabeth
Create a Home Valuation Report for This Property
The Home Valuation Report is an in-depth analysis detailing your home's value as well as a comparison with similar homes in the area
Home Values in the Area
Average Home Value in this Area
Purchase History
| Date | Buyer | Sale Price | Title Company |
|---|---|---|---|
| Oppliger Trevor Z | $360,000 | Chicago Title Company | |
| Reyna Elvia | $200,000 | Fidelity National Title Co | |
| Goldman Elizabeth | -- | -- |
Source: Public Records
Mortgage History
| Date | Status | Borrower | Loan Amount |
|---|---|---|---|
| Open | Oppliger Trevor Z | $288,000 | |
| Previous Owner | Reyna Elvia | $159,920 | |
| Closed | Reyna Elvia | $19,990 |
Source: Public Records
Tax History Compared to Growth
Tax History
| Year | Tax Paid | Tax Assessment Tax Assessment Total Assessment is a certain percentage of the fair market value that is determined by local assessors to be the total taxable value of land and additions on the property. | Land | Improvement |
|---|---|---|---|---|
| 2025 | $5,940 | $495,850 | $90,135 | $405,715 |
| 2023 | $5,825 | $476,597 | $86,636 | $389,961 |
| 2022 | $5,744 | $467,253 | $84,938 | $382,315 |
| 2021 | $5,583 | $458,092 | $83,273 | $374,819 |
| 2020 | $5,118 | $417,800 | $74,600 | $343,200 |
| 2019 | $4,798 | $399,900 | $71,400 | $328,500 |
| 2018 | $4,648 | $388,400 | $69,400 | $319,000 |
| 2017 | $4,393 | $366,500 | $65,500 | $301,000 |
| 2016 | $4,185 | $354,423 | $63,351 | $291,072 |
| 2015 | $4,120 | $349,100 | $62,400 | $286,700 |
| 2014 | $3,857 | $327,000 | $58,500 | $268,500 |
Source: Public Records
Map
Nearby Homes
- 520 W Barstow Ave
- 715 W Browning Ave
- 5672 N Ferger Ave
- 696 W Celeste Ave
- 5370 N Maroa Ave
- 548 W San Jose Ave
- 5655 N Poplar Ave
- 5549 N Del Mar Ave
- 665 W Escalon Ave
- 5180 N Wishon Ave Unit 201
- 5180 N Wishon Ave Unit 103
- 1159 W San Madele Ave
- 148 W Roberts Ave
- 5090 N Roosevelt Ave Unit 11
- 6164 N Maroa Ave
- 5076 N Wishon Ave Unit A
- 671 W Sample Ave
- 177 W Bullard Ave
- 365 W Escalon Ave
- 441 W Sample Ave
- 5532 N Colonial Ave
- 5562 N Colonial Ave
- 5545 N Remington Ave
- 5561 N Remington Ave
- 5531 N Remington Ave
- 5553 N Colonial Ave
- 5516 N Colonial Ave
- 593 W Browning Ave
- 5571 N Colonial Ave
- 5541 N Colonial Ave
- 577 W Browning Ave
- 5515 N Remington Ave
- 5523 N Colonial Ave
- 615 W Browning Ave
- 5502 N Colonial Ave
- 5570 N Roosevelt Ave
- 5501 N Remington Ave
- 5546 N Roosevelt Ave
- 5552 N Remington Ave
- 5564 N Remington Ave