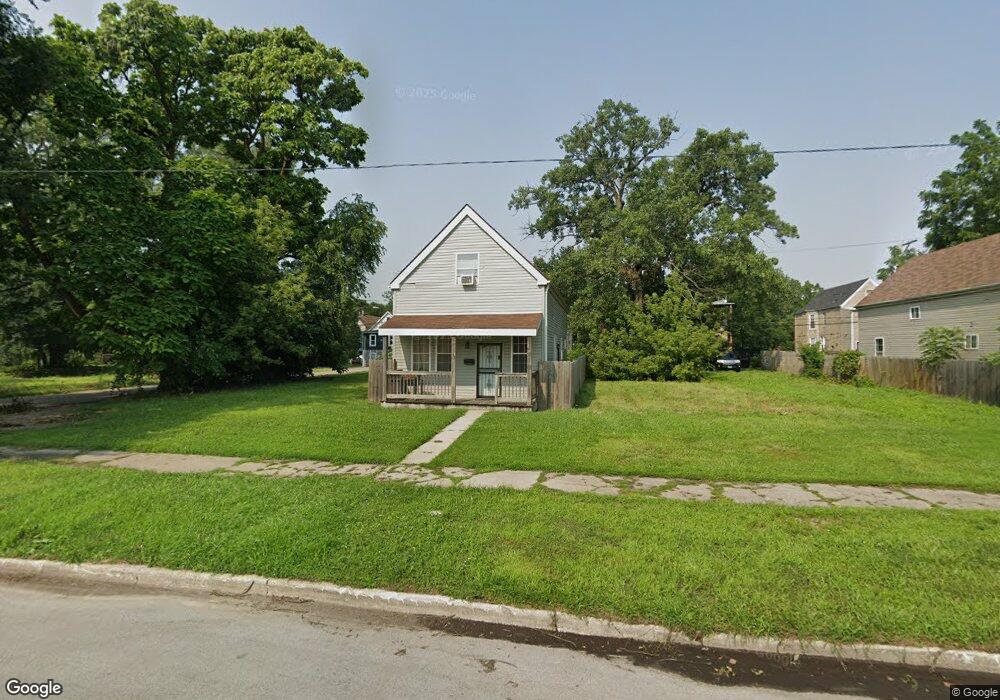
5546 S Lowe Ave Chicago, IL 60621
Englewood NeighborhoodEstimated Value: $147,222 - $183,000
3
Beds
3
Baths
1,368
Sq Ft
$119/Sq Ft
Est. Value
About This Home
This home is located at 5546 S Lowe Ave, Chicago, IL 60621 and is currently estimated at $162,556, approximately $118 per square foot. 5546 S Lowe Ave is a home located in Cook County with nearby schools including Dewey Elementary Academy Of Fine Arts, KIPP Bloom Charter Elementary School, and Visitation Catholic School.
Ownership History
Date
Name
Owned For
Owner Type
Purchase Details
Closed on
Jul 1, 2009
Sold by
Founders Bank
Bought by
Qs Lowe Llc
Current Estimated Value
Home Financials for this Owner
Home Financials are based on the most recent Mortgage that was taken out on this home.
Original Mortgage
$232,000
Outstanding Balance
$160,294
Interest Rate
6.5%
Mortgage Type
Construction
Estimated Equity
$2,262
Purchase Details
Closed on
Apr 7, 2009
Sold by
Skahill Robert
Bought by
Founders Bank
Purchase Details
Closed on
Jun 21, 2006
Sold by
First Suburban National Bank
Bought by
Founders Bank and Trust #6903
Purchase Details
Closed on
Oct 14, 2005
Sold by
Chicago Land Sales Co
Bought by
First Suburban National Bank and Trust #9913-01
Purchase Details
Closed on
May 26, 2005
Sold by
Orr David D
Bought by
Tax Acquisitions Inc
Purchase Details
Closed on
Apr 29, 2005
Sold by
Orr David D
Bought by
North Star Trust Co and Trust #05-8086
Create a Home Valuation Report for This Property
The Home Valuation Report is an in-depth analysis detailing your home's value as well as a comparison with similar homes in the area
Home Values in the Area
Average Home Value in this Area
Purchase History
| Date | Buyer | Sale Price | Title Company |
|---|---|---|---|
| Qs Lowe Llc | $60,000 | Attorneys Title Guaranty Fun | |
| Founders Bank | -- | None Available | |
| Founders Bank | -- | None Available | |
| First Suburban National Bank | $24,500 | Lasalle Title | |
| Tax Acquisitions Inc | -- | -- | |
| North Star Trust Co | -- | -- |
Source: Public Records
Mortgage History
| Date | Status | Borrower | Loan Amount |
|---|---|---|---|
| Open | Qs Lowe Llc | $232,000 |
Source: Public Records
Tax History Compared to Growth
Tax History
| Year | Tax Paid | Tax Assessment Tax Assessment Total Assessment is a certain percentage of the fair market value that is determined by local assessors to be the total taxable value of land and additions on the property. | Land | Improvement |
|---|---|---|---|---|
| 2024 | $1,160 | $11,001 | $938 | $10,063 |
| 2023 | $1,131 | $5,500 | $2,031 | $3,469 |
| 2022 | $1,131 | $5,500 | $2,031 | $3,469 |
| 2021 | $1,106 | $5,499 | $2,031 | $3,468 |
| 2020 | $2,675 | $12,010 | $2,031 | $9,979 |
| 2019 | $2,681 | $13,345 | $2,031 | $11,314 |
| 2018 | $2,636 | $13,345 | $2,031 | $11,314 |
| 2017 | $2,433 | $11,302 | $1,875 | $9,427 |
| 2016 | $2,264 | $11,302 | $1,875 | $9,427 |
| 2015 | $2,071 | $11,302 | $1,875 | $9,427 |
| 2014 | $2,067 | $11,143 | $1,718 | $9,425 |
| 2013 | $2,027 | $11,143 | $1,718 | $9,425 |
Source: Public Records
Map
Nearby Homes
- 5610 S Lowe Ave
- 5639 S Emerald Ave
- 5632 S Emerald Ave
- 710 W Garfield Blvd
- 1050 W 57th St
- 5743 S Emerald Ave
- 43-47 W Garfield Blvd
- 5644 S Green St
- 5751 S Lowe Ave
- 817 W 54th St
- 5718 S Green St
- 5706 S Peoria St
- 5837 S Union Ave
- 5307 S Emerald Ave
- 352 W 59th St
- 5732 S Sangamon St
- 5604 S Morgan St
- 1004 W 57th St
- 5549 S Shields Ave
- 5302 S Peoria St
- 5542 S Lowe Ave
- 5600 S Lowe Ave
- 5538 S Lowe Ave
- 5602 S Lowe Ave
- 5534 S Lowe Ave
- 5532 S Lowe Ave Unit 1
- 5545 S Union Ave
- 5545 S Union Ave
- 5537 S Union Ave
- 5537 S Union Ave
- 5601 S Union Ave
- 5549 S Union Ave
- 5612 S Lowe Ave
- 5612 S Lowe Ave
- 5533 S Union Ave
- 5529 S Union Ave
- 5529 S Union Ave
- 5529 S Union Ave Unit 1
- 5529 S Union Ave Unit 2
- 5609 S Union Ave