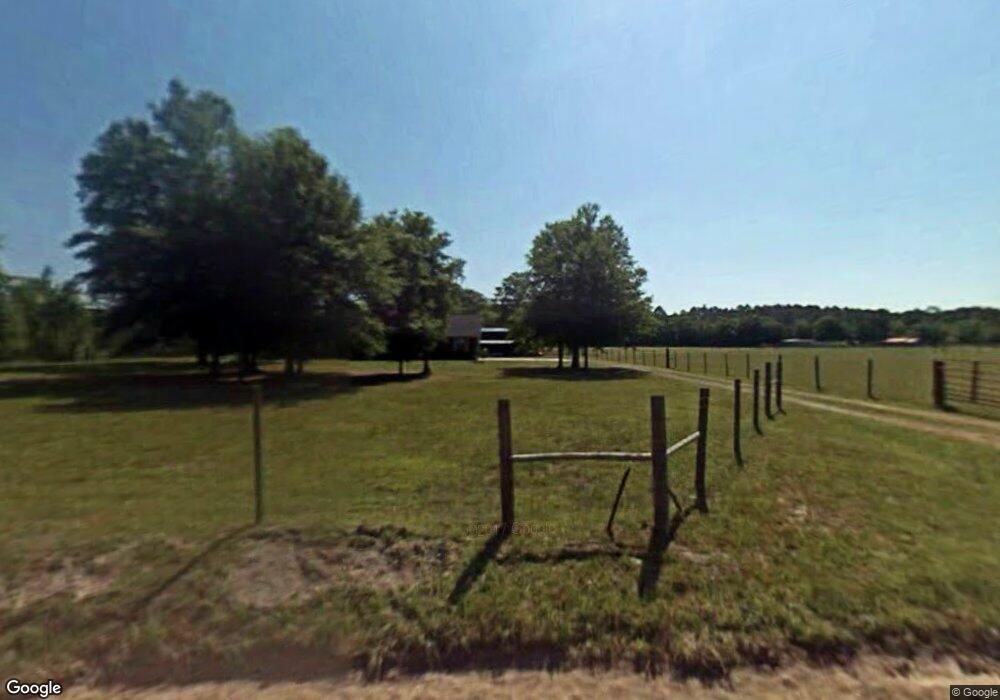
5548 Bowen Rd Blackshear, GA 31516
Estimated Value: $249,000 - $406,000
3
Beds
2
Baths
1,983
Sq Ft
$182/Sq Ft
Est. Value
About This Home
This home is located at 5548 Bowen Rd, Blackshear, GA 31516 and is currently estimated at $360,076, approximately $181 per square foot. 5548 Bowen Rd is a home located in Pierce County with nearby schools including Pierce County High School and Truth Christian Academy.
Ownership History
Date
Name
Owned For
Owner Type
Purchase Details
Closed on
Sep 19, 2014
Sold by
Adair Charles Cullen
Bought by
Carter Arthur
Current Estimated Value
Home Financials for this Owner
Home Financials are based on the most recent Mortgage that was taken out on this home.
Original Mortgage
$225,000
Outstanding Balance
$193,817
Interest Rate
4.15%
Mortgage Type
New Conventional
Estimated Equity
$166,259
Purchase Details
Closed on
Mar 22, 1999
Sold by
H B Properties Inc
Bought by
Adair Charles Cullen and Adair Cynthia A
Purchase Details
Closed on
Sep 4, 1997
Sold by
Bennett Kenneth
Bought by
H B Properties Inc
Purchase Details
Closed on
Jun 15, 1989
Sold by
Thomas Darrell and Sue Nell
Bought by
Bennett Kenneth
Purchase Details
Closed on
Dec 31, 1987
Sold by
Scott Robert Lloyd
Bought by
Thomas Darrell and Sue Nell
Purchase Details
Closed on
Feb 10, 1981
Sold by
Scott R L
Bought by
Scott Robert L
Purchase Details
Closed on
Feb 17, 1926
Sold by
Southern Farm Home Association
Bought by
Scott R L Etal
Create a Home Valuation Report for This Property
The Home Valuation Report is an in-depth analysis detailing your home's value as well as a comparison with similar homes in the area
Home Values in the Area
Average Home Value in this Area
Purchase History
| Date | Buyer | Sale Price | Title Company |
|---|---|---|---|
| Carter Arthur | $225,000 | -- | |
| Adair Charles Cullen | $19,500 | -- | |
| H B Properties Inc | -- | -- | |
| Bennett Kenneth | -- | -- | |
| Thomas Darrell | -- | -- | |
| Scott Robert L | -- | -- | |
| Scott R L Etal | -- | -- |
Source: Public Records
Mortgage History
| Date | Status | Borrower | Loan Amount |
|---|---|---|---|
| Open | Carter Arthur | $225,000 |
Source: Public Records
Tax History Compared to Growth
Tax History
| Year | Tax Paid | Tax Assessment Tax Assessment Total Assessment is a certain percentage of the fair market value that is determined by local assessors to be the total taxable value of land and additions on the property. | Land | Improvement |
|---|---|---|---|---|
| 2025 | $1,469 | $127,792 | $46,776 | $81,016 |
| 2024 | $1,469 | $126,141 | $46,776 | $79,365 |
| 2023 | $1,466 | $125,500 | $46,776 | $78,724 |
| 2022 | $1,761 | $98,938 | $30,633 | $68,305 |
| 2021 | $1,724 | $96,171 | $30,633 | $65,538 |
| 2020 | $1,748 | $93,405 | $30,633 | $62,772 |
| 2019 | $1,757 | $93,405 | $30,633 | $62,772 |
| 2018 | $1,722 | $89,180 | $29,174 | $60,006 |
| 2017 | $2,398 | $87,287 | $29,174 | $58,113 |
| 2016 | $1,762 | $90,360 | $29,174 | $61,186 |
| 2015 | $1,824 | $90,360 | $29,174 | $61,186 |
| 2014 | $1,824 | $75,587 | $14,400 | $61,186 |
| 2013 | $1,824 | $75,586 | $14,400 | $61,186 |
Source: Public Records
Map
Nearby Homes
- 5618 Bowen Rd
- 2304 Gillis Cir
- 5406 Blue Spruce Rd
- 2936 Piney Grove Cir
- 6737 Hacklebarney Rd
- 6116 Stoney Brook Dr
- 6112 Cottonwood Ln
- 3417 Bob Bowen Rd
- 2702 Ware St
- 862 Watson St
- 2656 Ware St
- 3344 Strickland Ave
- 3360 Strickland Avenue Extension
- 3239 Bob Bowen Rd
- 3011 Suncreek Ln
- 3551 Cason Rd
- 101 Fawn Ln
- 131 Fawn Ln
- 2026 Ellis Ln
- 121 Beaver Dr