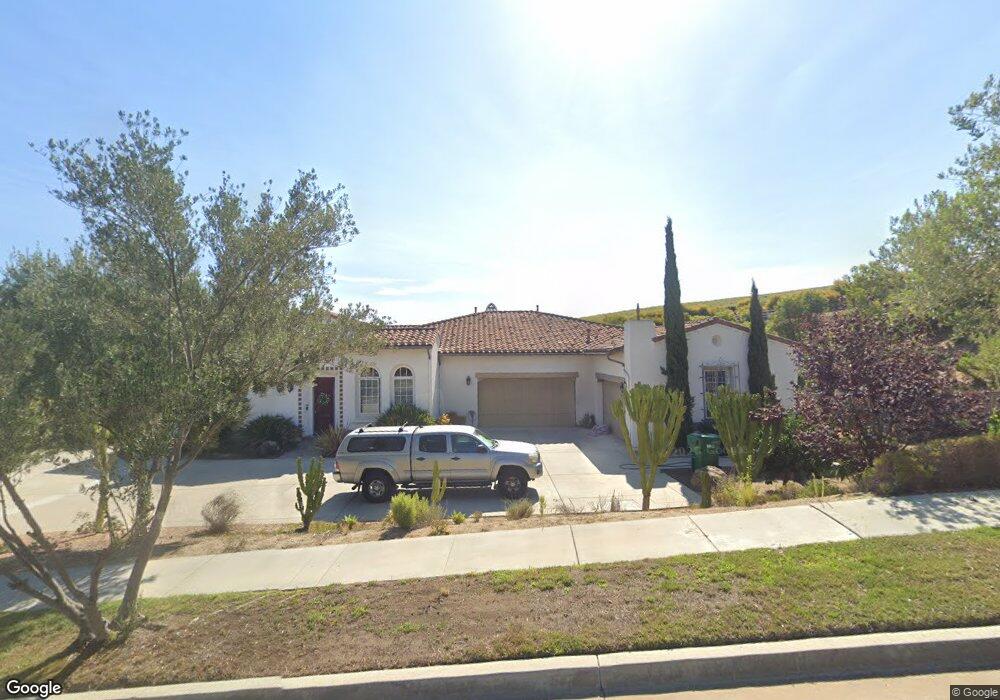
5548 Papagallo Dr Oceanside, CA 92057
North Valley NeighborhoodEstimated Value: $1,602,000 - $2,030,000
4
Beds
5
Baths
3,891
Sq Ft
$451/Sq Ft
Est. Value
About This Home
This home is located at 5548 Papagallo Dr, Oceanside, CA 92057 and is currently estimated at $1,756,550, approximately $451 per square foot. 5548 Papagallo Dr is a home located in San Diego County with nearby schools including Bonsall West Elementary School, Sullivan Middle School, and Bonsall High.
Ownership History
Date
Name
Owned For
Owner Type
Purchase Details
Closed on
Nov 5, 2009
Sold by
Bac Home Loans Servicing Lp
Bought by
Duclos Gregory Paul and Duclos Jennifer Noelle
Current Estimated Value
Home Financials for this Owner
Home Financials are based on the most recent Mortgage that was taken out on this home.
Original Mortgage
$579,920
Outstanding Balance
$378,471
Interest Rate
4.99%
Mortgage Type
New Conventional
Estimated Equity
$1,378,079
Purchase Details
Closed on
Jun 23, 2009
Sold by
Houser Dwight Francis and Houser Ruth Ingeborg
Bought by
Bac Home Loans Servicing Lp
Purchase Details
Closed on
May 21, 2007
Sold by
Kb Home Coastal Inc
Bought by
Houser Dwight Francis and Houser Ruth Ingeborg
Home Financials for this Owner
Home Financials are based on the most recent Mortgage that was taken out on this home.
Original Mortgage
$799,990
Interest Rate
7.12%
Mortgage Type
Unknown
Create a Home Valuation Report for This Property
The Home Valuation Report is an in-depth analysis detailing your home's value as well as a comparison with similar homes in the area
Home Values in the Area
Average Home Value in this Area
Purchase History
| Date | Buyer | Sale Price | Title Company |
|---|---|---|---|
| Duclos Gregory Paul | $725,000 | Landsafe Title | |
| Bac Home Loans Servicing Lp | $637,500 | Landsafe Title | |
| Houser Dwight Francis | $1,000,000 | First American Title |
Source: Public Records
Mortgage History
| Date | Status | Borrower | Loan Amount |
|---|---|---|---|
| Open | Duclos Gregory Paul | $579,920 | |
| Previous Owner | Houser Dwight Francis | $799,990 |
Source: Public Records
Tax History
| Year | Tax Paid | Tax Assessment Tax Assessment Total Assessment is a certain percentage of the fair market value that is determined by local assessors to be the total taxable value of land and additions on the property. | Land | Improvement |
|---|---|---|---|---|
| 2025 | $10,439 | $1,015,407 | $322,693 | $692,714 |
| 2024 | $10,439 | $995,498 | $316,366 | $679,132 |
| 2023 | $10,209 | $975,979 | $310,163 | $665,816 |
| 2022 | $10,031 | $956,843 | $304,082 | $652,761 |
| 2021 | $9,080 | $864,553 | $298,120 | $566,433 |
| 2020 | $9,007 | $855,689 | $295,064 | $560,625 |
| 2019 | $8,836 | $838,912 | $289,279 | $549,633 |
| 2018 | $8,880 | $822,463 | $283,607 | $538,856 |
| 2017 | $8,704 | $806,338 | $278,047 | $528,291 |
| 2016 | $8,499 | $790,529 | $272,596 | $517,933 |
| 2015 | $8,366 | $778,656 | $268,502 | $510,154 |
| 2014 | $8,161 | $760,000 | $285,000 | $475,000 |
Source: Public Records
Map
Nearby Homes
- 1120 Championship Rd
- 0 Wilshire Rd
- 5450 Alexandrine Ct
- 1058 Village Dr
- 1420 Wilshire Rd
- 1241 Breakaway Dr
- 1121 Midnight Way
- 5930 Camino Baja Cerro
- 1039 Eliot St
- 1491 Pilgrim Way
- 1486 Puritan Way
- 5586 Hadley Way
- 290 Hadley Way
- 924 Glendora Dr
- 278 Paxton Way
- 5133 Greenbrook St
- 456 Grove View Rd
- 5179 Via Mindanao
- 868 Panella Ct
- 273 Stallion Dr
- 5552 Papagallo Dr
- 5544 Papagallo Dr
- 5535 Papagallo Dr
- 5531 Papagallo Dr
- 5540 Papagallo Dr
- 5539 Papagallo Dr
- 2118 Timneh Ct
- 5538 Papagallo Dr
- 1006 Straightaway Ct
- 1010 Straightaway Ct
- 2105 Timneh Ct
- 5543 Papagallo Dr
- 1002 Straightaway Ct
- 1014 Straightaway Ct
- 2101 Timneth Ct
- 2109 Timneh Ct
- 1018 Straightaway Ct
- 1022 Straightaway Ct
- 0000 Straightaway Ln
- 2113 Timneh Ct
Your Personal Tour Guide
Ask me questions while you tour the home.