Estimated Value: $207,000 - $323,000
Studio
--
Bath
1,617
Sq Ft
$157/Sq Ft
Est. Value
About This Home
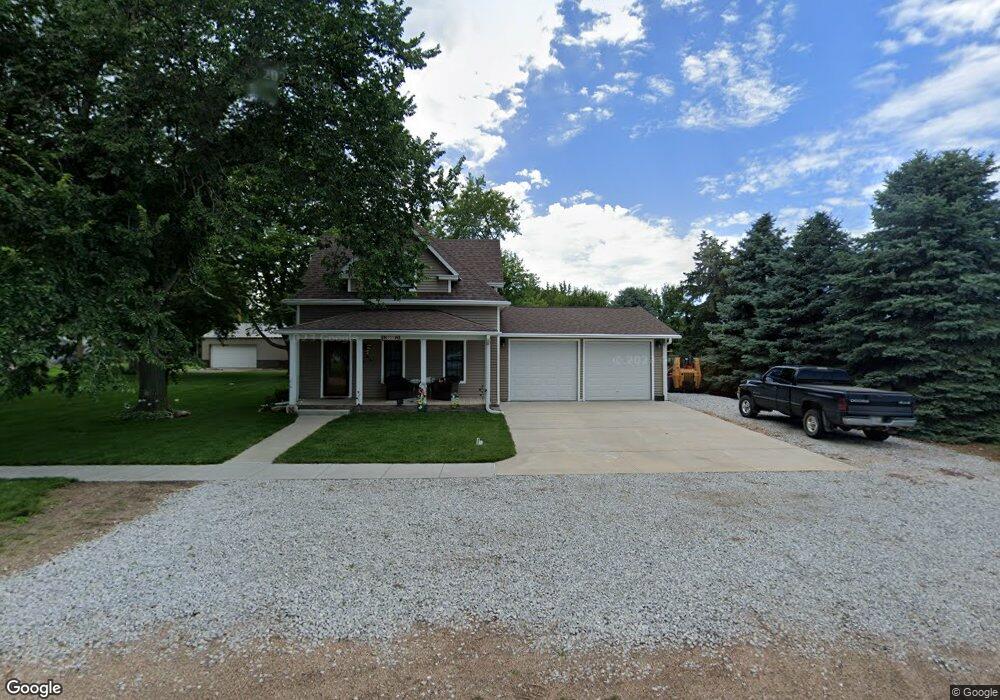
This home is located at 555 3rd St, Bee, NE 68314 and is currently estimated at $254,369, approximately $157 per square foot. 555 3rd St is a home with nearby schools including Seward Elementary School, Seward Middle School, and Seward High School.
Ownership History
Date
Name
Owned For
Owner Type
Purchase Details
Closed on
Oct 1, 2021
Sold by
Roberts Gary L and Roberts Sandra K
Bought by
Roberts Gary L and Roberts Sandra K
Current Estimated Value
Create a Home Valuation Report for This Property
The Home Valuation Report is an in-depth analysis detailing your home's value as well as a comparison with similar homes in the area
Purchase History
| Date | Buyer | Sale Price | Title Company |
|---|---|---|---|
| Roberts Gary L | -- | None Listed On Document |
Source: Public Records
Tax History
| Year | Tax Paid | Tax Assessment Tax Assessment Total Assessment is a certain percentage of the fair market value that is determined by local assessors to be the total taxable value of land and additions on the property. | Land | Improvement |
|---|---|---|---|---|
| 2025 | $2,368 | $216,146 | $19,320 | $196,826 |
| 2024 | $2,528 | $216,146 | $19,320 | $196,826 |
| 2023 | $2,950 | $201,833 | $19,320 | $182,513 |
| 2022 | $2,791 | $196,373 | $13,860 | $182,513 |
| 2021 | $2,211 | $149,055 | $13,860 | $135,195 |
| 2020 | $2,159 | $149,055 | $13,860 | $135,195 |
| 2019 | $1,999 | $149,055 | $13,860 | $135,195 |
| 2018 | $1,553 | $116,264 | $13,860 | $102,404 |
| 2017 | $1,048 | $78,749 | $11,760 | $66,989 |
| 2016 | $624 | $48,257 | $11,760 | $36,497 |
| 2015 | $400 | $28,982 | $11,760 | $17,222 |
| 2013 | $450 | $29,970 | $11,760 | $18,210 |
Source: Public Records
Map
Nearby Homes
- 210 and Little Salt Tbd Rd
- 0000 County Rd 252
- 2290 Old Mill Rd
- LOT 3 252 County Rd
- 000 Waverly Rd
- 268 S 4th St
- 215 S 3rd St
- 4 Indigo Ln Unit Lot 4
- 2 Blue Stem Way Unit Lot 2
- 3 Blue Stem Way Unit Lot 3
- 7 Indigo Ln Unit Lot 7
- 9 Blue Stem Way Unit Lot 9
- 8 Indigo Ln Unit Lot 8
- 5 Indigo Ln Unit Lot 5
- 1826 238th Rd
- 1802 238th Rd
- 2340 Street Rd Unit Lot 10
- 1975 Street Rd Unit Lot 1
- 0000 Branched Oak Rd
- 109 Ryan St
Your Personal Tour Guide
Ask me questions while you tour the home.