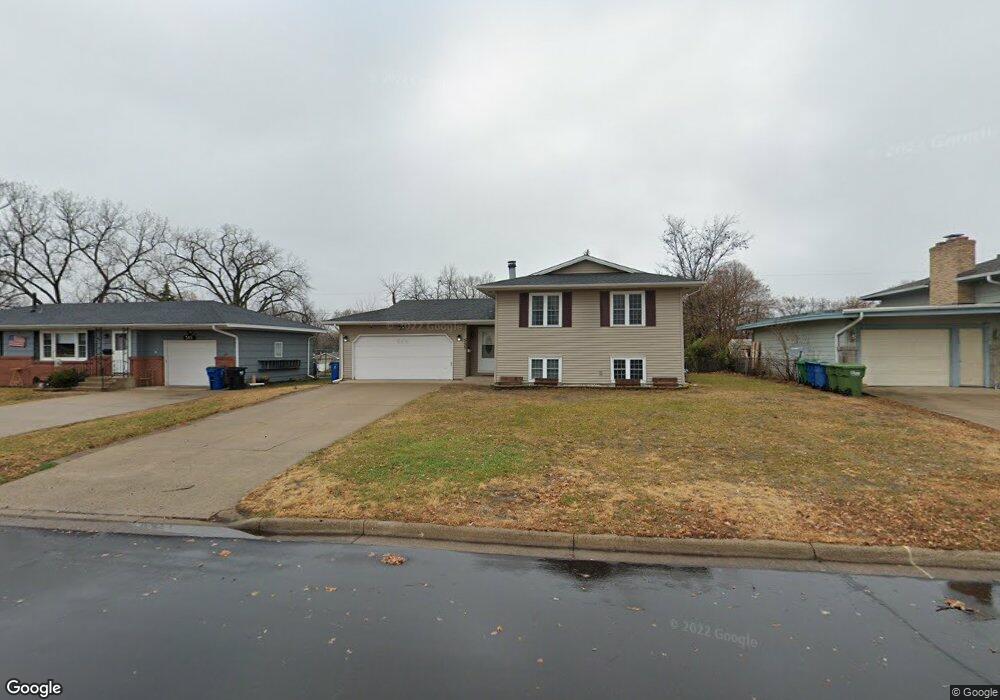
555 57th Ave NE Minneapolis, MN 55432
Estimated Value: $334,000 - $354,000
4
Beds
2
Baths
1,944
Sq Ft
$177/Sq Ft
Est. Value
About This Home
This home is located at 555 57th Ave NE, Minneapolis, MN 55432 and is currently estimated at $343,189, approximately $176 per square foot. 555 57th Ave NE is a home located in Anoka County with nearby schools including North Park Elementary School, Al-Amal School, and Totino-Grace High School.
Ownership History
Date
Name
Owned For
Owner Type
Purchase Details
Closed on
Nov 12, 2020
Sold by
Khamthanie Vanvisa
Bought by
Gomez Sergio Martinez and Gomez Maria Ventura
Current Estimated Value
Home Financials for this Owner
Home Financials are based on the most recent Mortgage that was taken out on this home.
Original Mortgage
$212,000
Outstanding Balance
$188,650
Interest Rate
2.8%
Mortgage Type
New Conventional
Estimated Equity
$154,539
Purchase Details
Closed on
Sep 18, 2009
Sold by
Khamthani Pranom and Neiamraxsa Suwan
Bought by
Khamthanie Vanvisa
Home Financials for this Owner
Home Financials are based on the most recent Mortgage that was taken out on this home.
Original Mortgage
$141,391
Interest Rate
5.37%
Mortgage Type
FHA
Purchase Details
Closed on
Oct 25, 1996
Sold by
Lueck Dennis A and Lueck Lisa M
Bought by
Khamthani Pranom
Create a Home Valuation Report for This Property
The Home Valuation Report is an in-depth analysis detailing your home's value as well as a comparison with similar homes in the area
Home Values in the Area
Average Home Value in this Area
Purchase History
| Date | Buyer | Sale Price | Title Company |
|---|---|---|---|
| Gomez Sergio Martinez | $265,000 | Titlesmart Inc | |
| Khamthanie Vanvisa | $145,000 | -- | |
| Khamthani Pranom | $115,000 | -- | |
| Martinez Gomez Sergio Sergio | $265,000 | -- |
Source: Public Records
Mortgage History
| Date | Status | Borrower | Loan Amount |
|---|---|---|---|
| Open | Gomez Sergio Martinez | $212,000 | |
| Previous Owner | Khamthanie Vanvisa | $141,391 | |
| Closed | Martinez Gomez Sergio Sergio | $262,500 |
Source: Public Records
Tax History Compared to Growth
Tax History
| Year | Tax Paid | Tax Assessment Tax Assessment Total Assessment is a certain percentage of the fair market value that is determined by local assessors to be the total taxable value of land and additions on the property. | Land | Improvement |
|---|---|---|---|---|
| 2025 | $3,921 | $317,200 | $100,500 | $216,700 |
| 2024 | $3,921 | $296,600 | $89,300 | $207,300 |
| 2023 | $3,600 | $293,500 | $74,400 | $219,100 |
| 2022 | $2,661 | $300,800 | $76,000 | $224,800 |
| 2021 | $2,832 | $239,800 | $66,600 | $173,200 |
| 2020 | $2,630 | $238,900 | $62,300 | $176,600 |
| 2019 | $2,429 | $227,500 | $62,800 | $164,700 |
| 2018 | $2,360 | $208,600 | $0 | $0 |
| 2017 | $2,429 | $190,800 | $0 | $0 |
| 2016 | $2,401 | $164,900 | $0 | $0 |
| 2015 | -- | $164,900 | $50,900 | $114,000 |
| 2014 | -- | $144,800 | $43,900 | $100,900 |
Source: Public Records
Map
Nearby Homes
- 5751 7th St NE
- 610 57th Ave NE
- 655 57th Ave NE
- 650 58th Ave NE
- 5724 4th St NE
- 5724 W Moore Lake Dr NE
- 5820 2 1 2 St NE
- 6120 7th St NE
- 5207 7th St NE
- 613 Sullivan Dr NE
- 6220 Carol Dr NE
- 524 63rd Ave NE
- 5144 Horizon Dr NE
- 5000 Washington St NE
- 5006 6th St NE
- 5246 Fillmore St NE
- 6310 Jackson St NE
- 261 Sylvan Ln NE
- 5895 Tennison Dr NE
- 6340 Quincy St NE
- 545 57th Ave NE
- 535 57th Ave NE
- 5701 Washington St NE
- 575 57th Ave NE
- 560 57th Ave NE
- 550 57th Ave NE
- 570 57th Ave NE
- 540 57th Ave NE
- 5703 Washington St NE
- 525 57th Ave NE
- 585 57th Ave NE
- 5704 Jefferson St NE
- 530 57th Ave NE
- 580 57th Ave NE
- 5700 Washington St NE
- 5705 Washington St NE
- 5708 Jefferson St NE
- 595 57th Ave NE
- 515 57th Ave NE
- 520 57th Ave NE