Estimated Value: $990,000 - $1,125,000
2
Beds
2
Baths
1,135
Sq Ft
$916/Sq Ft
Est. Value
About This Home
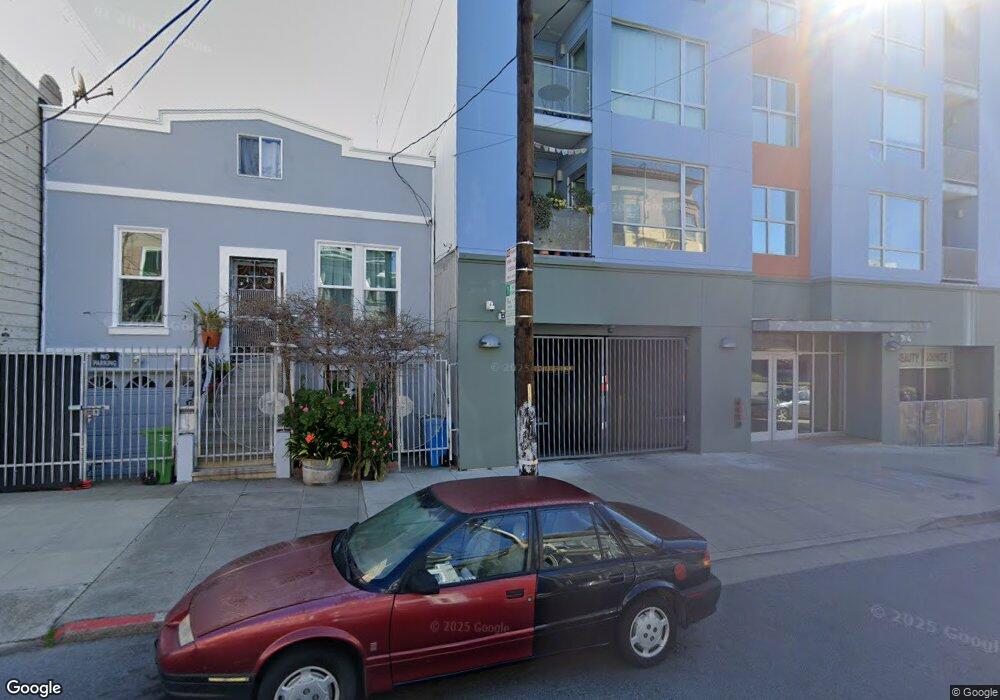
This home is located at 555 Bartlett St Unit 413, San Francisco, CA 94110 and is currently estimated at $1,039,381, approximately $915 per square foot. 555 Bartlett St Unit 413 is a home located in San Francisco County with nearby schools including Alvarado Elementary, James Lick Middle School, and Katherine Michiels School.
Ownership History
Date
Name
Owned For
Owner Type
Purchase Details
Closed on
Dec 13, 2024
Sold by
Leon Michelle Kimberly and Yi Mack Renwu
Bought by
Leon Michelle Kimberly
Current Estimated Value
Purchase Details
Closed on
Apr 25, 2022
Sold by
Gong and Lillian
Bought by
Gong Kyle and Chen Lillian
Purchase Details
Closed on
Nov 18, 2016
Sold by
Kim Angela W
Bought by
Gong Kyle and Chen Lillian
Home Financials for this Owner
Home Financials are based on the most recent Mortgage that was taken out on this home.
Original Mortgage
$920,000
Interest Rate
3.12%
Mortgage Type
Adjustable Rate Mortgage/ARM
Purchase Details
Closed on
Jun 1, 2011
Sold by
Kim Angela W
Bought by
Kim Angela W
Purchase Details
Closed on
Apr 14, 2010
Sold by
Seven Hills Properties 15 Llc
Bought by
Kim Angela W
Home Financials for this Owner
Home Financials are based on the most recent Mortgage that was taken out on this home.
Original Mortgage
$175,001
Interest Rate
4.35%
Mortgage Type
New Conventional
Create a Home Valuation Report for This Property
The Home Valuation Report is an in-depth analysis detailing your home's value as well as a comparison with similar homes in the area
Home Values in the Area
Average Home Value in this Area
Purchase History
| Date | Buyer | Sale Price | Title Company |
|---|---|---|---|
| Leon Michelle Kimberly | -- | Stewart Title | |
| Gong Kyle | -- | Fidelity National Title | |
| Gong Kyle | $1,150,000 | Fidelity National Title Co | |
| Kim Angela W | -- | None Available | |
| Kim Angela W | $695,000 | Old Republic Title Company |
Source: Public Records
Mortgage History
| Date | Status | Borrower | Loan Amount |
|---|---|---|---|
| Previous Owner | Gong Kyle | $920,000 | |
| Previous Owner | Kim Angela W | $175,001 |
Source: Public Records
Tax History Compared to Growth
Tax History
| Year | Tax Paid | Tax Assessment Tax Assessment Total Assessment is a certain percentage of the fair market value that is determined by local assessors to be the total taxable value of land and additions on the property. | Land | Improvement |
|---|---|---|---|---|
| 2025 | $13,342 | $1,093,040 | $655,824 | $437,216 |
| 2024 | $13,342 | $1,071,610 | $642,966 | $428,644 |
| 2023 | $13,139 | $1,050,600 | $630,360 | $420,240 |
| 2022 | $14,326 | $1,159,261 | $695,557 | $463,704 |
| 2021 | $14,070 | $1,136,531 | $681,919 | $454,612 |
| 2020 | $14,188 | $1,124,878 | $674,927 | $449,951 |
| 2019 | $13,652 | $1,102,823 | $661,694 | $441,129 |
| 2018 | $13,191 | $1,081,200 | $648,720 | $432,480 |
| 2017 | $8,480 | $689,940 | $344,970 | $344,970 |
| 2016 | $8,328 | $676,412 | $338,206 | $338,206 |
| 2015 | $8,224 | $666,252 | $333,126 | $333,126 |
| 2014 | $8,009 | $653,202 | $326,601 | $326,601 |
Source: Public Records
About This Building
Map
Nearby Homes
- 3418 26th St Unit 1
- 3328 26th St
- 1030 Capp St
- 3779 3781 25th St
- 1206 1208 Utah St
- 2950 2952 25th St
- 578 San Jose Ave
- 31-31A Coleridge St
- 350 San Jose Ave Unit 7
- 350 San Jose Ave Unit 5
- 350 San Jose Ave Unit 12
- 350 San Jose Ave Unit 6
- 31 Coleridge St
- 340 San Jose Ave
- 1350 Shotwell St
- 980 Capp St
- 370 Bartlett St Unit 3
- 1336b Guerrero St Unit A
- 1294 Guerrero St
- 3340-3342 24th St
- 555 Bartlett St Unit 203
- 555 Bartlett St Unit 415
- 555 Bartlett St Unit 422
- 555 Bartlett St Unit 402
- 555 Bartlett St Unit 323
- 555 Bartlett St Unit 223
- 555 Bartlett St Unit 411
- 555 Bartlett St Unit 310
- 555 Bartlett St Unit 407
- 555 Bartlett St Unit 321
- 555 Bartlett St Unit 406
- 555 Bartlett St Unit 315
- 555 Bartlett St Unit 313
- 555 Bartlett St Unit 309
- 555 Bartlett St Unit 306
- 555 Bartlett St Unit 215
- 555 Bartlett St Unit 213
- 555 Bartlett St Unit 221
- 555 Bartlett St Unit 207
- 555 Bartlett St Unit 209