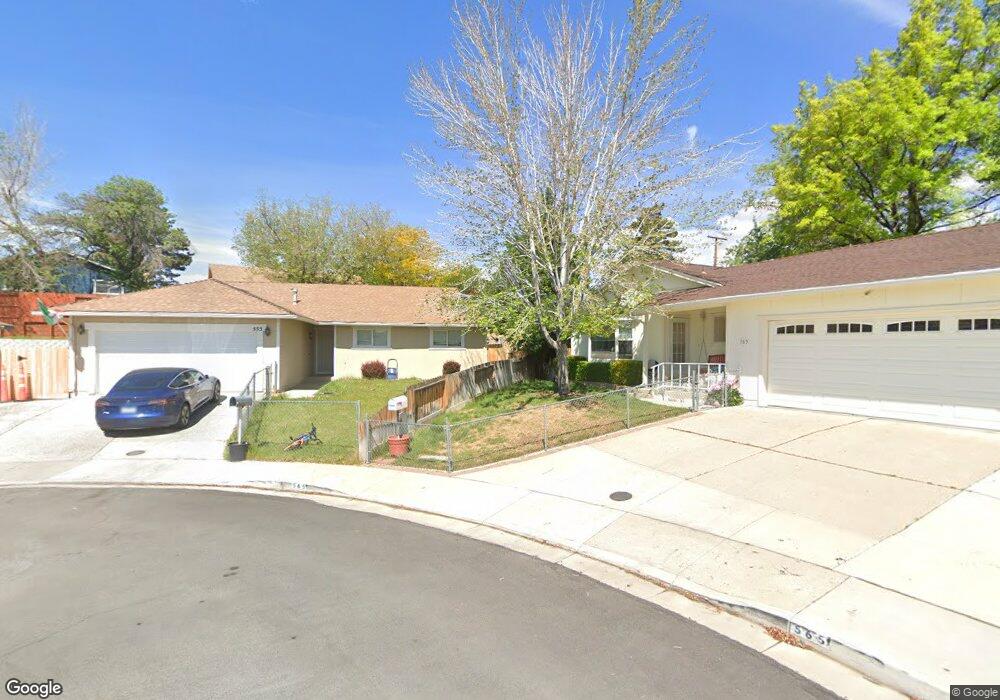
555 Ferol Way Reno, NV 89503
Kings Row NeighborhoodEstimated Value: $469,000 - $491,225
3
Beds
2
Baths
1,336
Sq Ft
$358/Sq Ft
Est. Value
About This Home
This home is located at 555 Ferol Way, Reno, NV 89503 and is currently estimated at $478,056, approximately $357 per square foot. 555 Ferol Way is a home located in Washoe County with nearby schools including Elmcrest Elementary School, Archie Clayton Pre-AP Academy, and Reno High School.
Ownership History
Date
Name
Owned For
Owner Type
Purchase Details
Closed on
Dec 27, 2005
Sold by
Deweerd John and Totorica Irene M
Bought by
Deweerd John and Totorica Irene M
Current Estimated Value
Purchase Details
Closed on
Aug 28, 2002
Sold by
Flaa Joanne P
Bought by
Deweerd John and Totorica Irene M
Home Financials for this Owner
Home Financials are based on the most recent Mortgage that was taken out on this home.
Original Mortgage
$132,000
Outstanding Balance
$55,905
Interest Rate
6.43%
Estimated Equity
$422,151
Purchase Details
Closed on
Nov 24, 1998
Sold by
Sugi Steven C and Sugi Joanne P
Bought by
Sugi Joanne P
Home Financials for this Owner
Home Financials are based on the most recent Mortgage that was taken out on this home.
Original Mortgage
$73,950
Interest Rate
6.84%
Create a Home Valuation Report for This Property
The Home Valuation Report is an in-depth analysis detailing your home's value as well as a comparison with similar homes in the area
Home Values in the Area
Average Home Value in this Area
Purchase History
| Date | Buyer | Sale Price | Title Company |
|---|---|---|---|
| Deweerd John | -- | None Available | |
| Deweerd John | $165,000 | First American Title | |
| Flaa Joanne P | -- | First American Title | |
| Sugi Joanne P | -- | Western Title Company Inc |
Source: Public Records
Mortgage History
| Date | Status | Borrower | Loan Amount |
|---|---|---|---|
| Open | Deweerd John | $132,000 | |
| Previous Owner | Sugi Joanne P | $73,950 |
Source: Public Records
Tax History Compared to Growth
Tax History
| Year | Tax Paid | Tax Assessment Tax Assessment Total Assessment is a certain percentage of the fair market value that is determined by local assessors to be the total taxable value of land and additions on the property. | Land | Improvement |
|---|---|---|---|---|
| 2025 | $1,337 | $61,637 | $39,795 | $21,842 |
| 2024 | $1,337 | $60,176 | $37,485 | $22,691 |
| 2023 | $0 | $61,252 | $39,200 | $22,052 |
| 2022 | $1,263 | $50,318 | $31,500 | $18,818 |
| 2021 | $1,227 | $40,476 | $21,245 | $19,231 |
| 2020 | $1,188 | $39,691 | $19,985 | $19,706 |
| 2019 | $1,131 | $39,728 | $20,300 | $19,428 |
| 2018 | $1,099 | $33,832 | $14,455 | $19,377 |
| 2017 | $1,066 | $32,682 | $12,915 | $19,767 |
| 2016 | $1,042 | $31,870 | $11,340 | $20,530 |
| 2015 | $266 | $30,492 | $9,625 | $20,867 |
| 2014 | $1,008 | $28,965 | $8,575 | $20,390 |
| 2013 | -- | $26,589 | $6,125 | $20,464 |
Source: Public Records
Map
Nearby Homes
- 1970 W 6th St
- 1785 Stardust St
- 2100 W 6th St
- 1801 Carlin St
- 2260 W 6th St
- 880 Ruby Ave
- 895 Stoker Ave
- 2595 W 7th St
- 2091 W 4th St
- 610 Akard Cir
- 1670 Majestic Dr
- 1600 Majestic Dr
- 2300 Dickerson Rd Unit 8
- 2300 Dickerson Rd Unit 16
- 2300 Dickerson Rd Unit 32
- 1855 Prince Way
- 1413 Solitude Trail
- 730 James Ct
- 1510 Majestic Dr Unit one
- 2718 Powder Dr