Estimated Value: $2,949,537
--
Bed
--
Bath
11,086
Sq Ft
$266/Sq Ft
Est. Value
About This Home
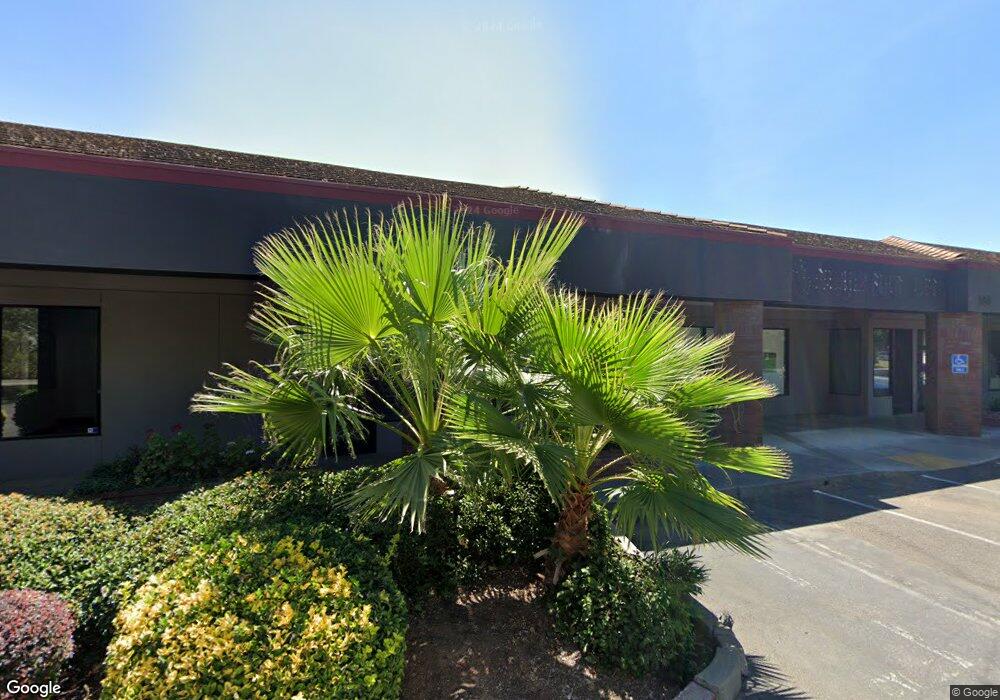
This home is located at 555 Flying V St Unit Suite 10, Chico, CA 95928 and is currently estimated at $2,949,537, approximately $266 per square foot. 555 Flying V St Unit Suite 10 is a home located in Butte County with nearby schools including Little Chico Creek Elementary School, Harry M. Marsh Junior High School, and Chico High School.
Ownership History
Date
Name
Owned For
Owner Type
Purchase Details
Closed on
Dec 7, 2021
Sold by
Vanthi Uong Thanh and Uong Teresa Hoa
Bought by
Vanthi Uong Thanh and Uong Teresa Hoa
Current Estimated Value
Purchase Details
Closed on
Dec 3, 2021
Sold by
Depper Stuart
Bought by
Vanthi Uong Thanh
Purchase Details
Closed on
Mar 7, 2018
Sold by
Dinh Peter Huong
Bought by
Uong Teresa Hoa
Purchase Details
Closed on
Mar 5, 2018
Sold by
Depper Stuart
Bought by
Thi Uong Thanh Van
Purchase Details
Closed on
Oct 27, 2008
Sold by
Amaral Greg
Bought by
Friedland Boctor Enterprises Llc
Create a Home Valuation Report for This Property
The Home Valuation Report is an in-depth analysis detailing your home's value as well as a comparison with similar homes in the area
Home Values in the Area
Average Home Value in this Area
Purchase History
| Date | Buyer | Sale Price | Title Company |
|---|---|---|---|
| Vanthi Uong Thanh | $450,000 | Bidwell Title & Escrow Co | |
| Vanthi Uong Thanh | -- | Bidwell Title & Escrow Co | |
| Uong Teresa Hoa | -- | Bidwell Title & Escrow Co | |
| Vanthi Uong Thanh | $2,110,000 | Bidwell Title & Escrow Co | |
| Thi Uong Thanh Van | -- | Bidwell Title & Escrow Co | |
| Friedland Boctor Enterprises Llc | $1,475,000 | Fidelity Natl Title Co Of Ca |
Source: Public Records
Mortgage History
| Date | Status | Borrower | Loan Amount |
|---|---|---|---|
| Closed | Uong Teresa Hoa | $0 |
Source: Public Records
Tax History Compared to Growth
Tax History
| Year | Tax Paid | Tax Assessment Tax Assessment Total Assessment is a certain percentage of the fair market value that is determined by local assessors to be the total taxable value of land and additions on the property. | Land | Improvement |
|---|---|---|---|---|
| 2025 | $25,993 | $2,398,197 | $964,740 | $1,433,457 |
| 2024 | $25,993 | $2,351,174 | $945,824 | $1,405,350 |
| 2023 | $25,703 | $2,305,074 | $927,279 | $1,377,795 |
| 2022 | $25,299 | $2,259,878 | $909,098 | $1,350,780 |
| 2021 | $24,845 | $2,217,985 | $893,501 | $1,324,484 |
| 2020 | $24,787 | $2,195,244 | $884,340 | $1,310,904 |
| 2019 | $24,338 | $2,152,200 | $867,000 | $1,285,200 |
| 2018 | $15,027 | $1,324,684 | $585,069 | $739,615 |
| 2017 | $14,707 | $1,298,711 | $573,598 | $725,113 |
| 2016 | $13,444 | $1,273,247 | $562,351 | $710,896 |
| 2015 | -- | $1,254,122 | $553,904 | $700,218 |
| 2014 | -- | $1,200,000 | $425,000 | $775,000 |
Source: Public Records
Map
Nearby Homes
- 12 Wrangler Ct
- 2375 Notre Dame Blvd Unit 1
- 2375 Notre Dame Blvd Unit 8
- 2176 Huntington Dr
- 4 Freda Ct
- 18 Jasper Dr
- 123 Raley Blvd
- 0 5 9 Ac Corner of Yosemite & Humboldt Rd Unit SN25118517
- 0 Rim Rock Dr Unit PA25101414
- 0 Rim Rock Dr Unit SN24199604
- 13 Betsey Way
- 2213 Laurel St
- 2071 Chadwick Dr
- 2050 Springfield Dr Unit 303
- 0 Speedway Ave
- 9 Anna Ct
- 999 E 16th St
- 2099 Hartford Dr Unit 8
- 1671 Thea Ave
- 2234 Hutchinson St
- 555 Flying V St
- 555 Flying V St Unit 30
- 555 Flying V St Unit 3
- 555 Flying V St Unit 1
- 555 Flying V St Unit Suite 5
- 555 Flying V St Unit Suite 6
- 555 Flying V St Unit 4
- 555 Flying V St Unit 5
- 755 Flying V St
- 0 Flying V St
- 550 Flying V St
- 2268 La Rocco Dr
- 2221 Forest Ave
- 2264 La Rocco Dr
- 765 Flying V St
- 2261 La Rocco Dr
- 2260 La Rocco Dr
- 2259 La Rocco Dr
- 977 Flying V St
- 2064 Talbert Dr Unit 303