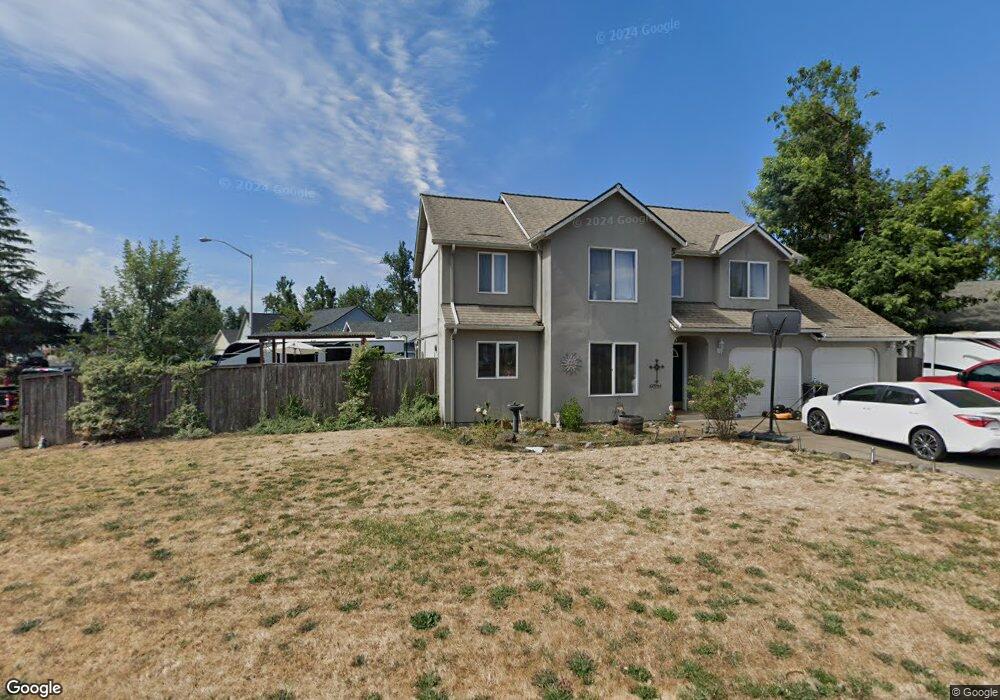
555 Pine Ct Creswell, OR 97426
Estimated Value: $390,000 - $430,204
3
Beds
3
Baths
1,448
Sq Ft
$288/Sq Ft
Est. Value
About This Home
This home is located at 555 Pine Ct, Creswell, OR 97426 and is currently estimated at $416,551, approximately $287 per square foot. 555 Pine Ct is a home located in Lane County with nearby schools including Creslane Elementary School, Creswell Middle School, and Creswell High School.
Ownership History
Date
Name
Owned For
Owner Type
Purchase Details
Closed on
May 11, 2010
Sold by
Black Kyle S and Black Brandi L
Bought by
Clark Jeffery Len
Current Estimated Value
Home Financials for this Owner
Home Financials are based on the most recent Mortgage that was taken out on this home.
Original Mortgage
$170,000
Outstanding Balance
$122,621
Interest Rate
5.04%
Mortgage Type
Purchase Money Mortgage
Estimated Equity
$293,930
Purchase Details
Closed on
Jun 13, 2008
Sold by
Burns Ashley D
Bought by
Black Kyle S and Black Brandi L
Home Financials for this Owner
Home Financials are based on the most recent Mortgage that was taken out on this home.
Original Mortgage
$201,802
Interest Rate
6.05%
Mortgage Type
FHA
Purchase Details
Closed on
Jun 28, 2005
Sold by
Bennett Alan C and Blum Tamara L
Bought by
Burns Ashley D
Home Financials for this Owner
Home Financials are based on the most recent Mortgage that was taken out on this home.
Original Mortgage
$148,400
Interest Rate
5.12%
Mortgage Type
Purchase Money Mortgage
Create a Home Valuation Report for This Property
The Home Valuation Report is an in-depth analysis detailing your home's value as well as a comparison with similar homes in the area
Home Values in the Area
Average Home Value in this Area
Purchase History
| Date | Buyer | Sale Price | Title Company |
|---|---|---|---|
| Clark Jeffery Len | $166,000 | First American Title | |
| Black Kyle S | $204,970 | Cascade Title Co | |
| Burns Ashley D | $185,500 | First American Title |
Source: Public Records
Mortgage History
| Date | Status | Borrower | Loan Amount |
|---|---|---|---|
| Open | Clark Jeffery Len | $170,000 | |
| Previous Owner | Black Kyle S | $201,802 | |
| Previous Owner | Burns Ashley D | $148,400 |
Source: Public Records
Tax History
| Year | Tax Paid | Tax Assessment Tax Assessment Total Assessment is a certain percentage of the fair market value that is determined by local assessors to be the total taxable value of land and additions on the property. | Land | Improvement |
|---|---|---|---|---|
| 2025 | $3,630 | $221,187 | -- | -- |
| 2024 | $2,715 | $214,745 | -- | -- |
| 2023 | $2,715 | $208,491 | -- | -- |
| 2022 | $2,925 | $202,419 | $0 | $0 |
| 2021 | $2,825 | $196,524 | $0 | $0 |
| 2020 | $2,786 | $190,800 | $0 | $0 |
| 2019 | $2,724 | $185,243 | $0 | $0 |
| 2018 | $2,686 | $174,610 | $0 | $0 |
| 2017 | $2,606 | $174,610 | $0 | $0 |
| 2016 | $2,669 | $169,524 | $0 | $0 |
| 2015 | $2,572 | $164,586 | $0 | $0 |
| 2014 | $2,551 | $159,792 | $0 | $0 |
Source: Public Records
Map
Nearby Homes
- 1165 Swale Ridge Loop
- 460 Meadow Ln
- 1121 Cedar Place
- 549 Gilfry Ave
- 632 N 5th St
- 524 N 5th St
- 573 Creswood Dr
- 362 Camrin Loop
- 961 Bush Ln
- 33465 Irish Ln
- 326 Auburn Ln
- 272 S 7th St
- 300 S 7th St
- 41 Sandalwood Loop
- 83354 N Pacific Hwy
- 400 N Mill St Unit 48
- 630 S 10th St
- 700 N Mill St Unit 1
- 700 N Mill St Unit 69
- 700 N Mill St Unit 21
Your Personal Tour Guide
Ask me questions while you tour the home.