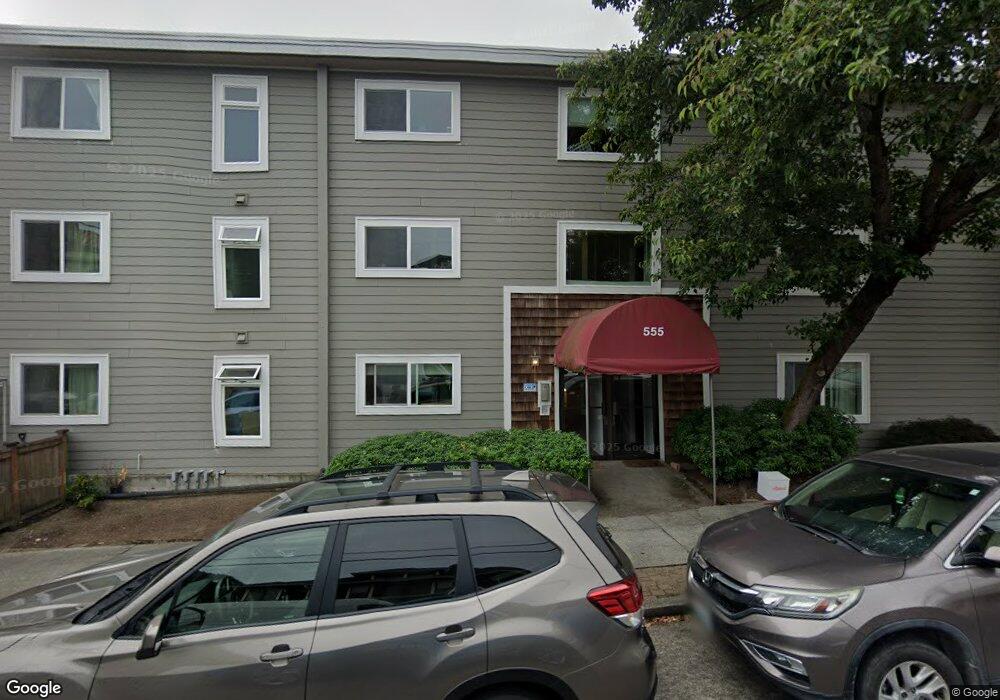
555 Prospect St Unit 1 Seattle, WA 98109
East Queen Anne NeighborhoodEstimated Value: $471,000 - $758,000
2
Beds
2
Baths
1,070
Sq Ft
$573/Sq Ft
Est. Value
About This Home
This home is located at 555 Prospect St Unit 1, Seattle, WA 98109 and is currently estimated at $612,820, approximately $572 per square foot. 555 Prospect St Unit 1 is a home located in King County with nearby schools including John Hay Elementary School, Mcclure Middle School, and Lincoln High School.
Ownership History
Date
Name
Owned For
Owner Type
Purchase Details
Closed on
Sep 18, 2017
Sold by
Rose Karla and Rose Philip
Bought by
Berka Blaire Lee and Berka Jack Webb
Current Estimated Value
Home Financials for this Owner
Home Financials are based on the most recent Mortgage that was taken out on this home.
Original Mortgage
$200,000
Outstanding Balance
$167,014
Interest Rate
3.9%
Mortgage Type
New Conventional
Estimated Equity
$445,806
Purchase Details
Closed on
Sep 23, 2008
Sold by
Lindeman George
Bought by
Halstrom Karla and Rose Philip
Home Financials for this Owner
Home Financials are based on the most recent Mortgage that was taken out on this home.
Original Mortgage
$307,405
Interest Rate
6.49%
Mortgage Type
FHA
Purchase Details
Closed on
Oct 11, 1996
Sold by
Hixon Gail Rooks and Nunziato Gail Rooks
Bought by
Lindeman George
Purchase Details
Closed on
Oct 1, 1996
Sold by
Durfee Marcia A
Bought by
Hixon Gail Rooks and Nunziato Gail Rooks
Create a Home Valuation Report for This Property
The Home Valuation Report is an in-depth analysis detailing your home's value as well as a comparison with similar homes in the area
Home Values in the Area
Average Home Value in this Area
Purchase History
| Date | Buyer | Sale Price | Title Company |
|---|---|---|---|
| Berka Blaire Lee | $500,000 | Old Republic Title Ltd | |
| Halstrom Karla | $313,000 | Fidelity National Title | |
| Lindeman George | $66,000 | Evergreen Title Company Inc | |
| Hixon Gail Rooks | -- | Evergreen Title Company Inc |
Source: Public Records
Mortgage History
| Date | Status | Borrower | Loan Amount |
|---|---|---|---|
| Open | Berka Blaire Lee | $200,000 | |
| Previous Owner | Halstrom Karla | $307,405 |
Source: Public Records
Tax History Compared to Growth
Tax History
| Year | Tax Paid | Tax Assessment Tax Assessment Total Assessment is a certain percentage of the fair market value that is determined by local assessors to be the total taxable value of land and additions on the property. | Land | Improvement |
|---|---|---|---|---|
| 2024 | $4,379 | $455,000 | $171,900 | $283,100 |
| 2023 | $4,116 | $470,000 | $171,900 | $298,100 |
| 2022 | $4,311 | $486,000 | $172,600 | $313,400 |
| 2021 | $4,117 | $470,000 | $172,600 | $297,400 |
| 2020 | $4,728 | $426,000 | $172,600 | $253,400 |
| 2018 | $3,745 | $496,000 | $157,300 | $338,700 |
| 2017 | $3,135 | $379,000 | $113,400 | $265,600 |
| 2016 | $2,939 | $327,000 | $91,400 | $235,600 |
| 2015 | $3,331 | $299,000 | $84,100 | $214,900 |
| 2014 | -- | $349,000 | $76,800 | $272,200 |
| 2013 | -- | $273,000 | $73,100 | $199,900 |
Source: Public Records
Map
Nearby Homes
- 554 Prospect St
- 566 Prospect St Unit 209
- 556 Highland Dr
- 1016 6th Ave N Unit 102
- 510 Ward St Unit 401
- 1200 6th Ave N Unit 6
- 612 Prospect St Unit 1
- 1002 5th Ave N
- 1222 6th Ave N
- 1234 Taylor Ave N Unit 401
- 418 Highland Dr Unit 4
- 405 Prospect St Unit 201
- 417 Ward St
- 610 Aloha St Unit 401
- 1312 6th Ave N Unit 9
- 371 Prospect St
- 1000 Aurora Ave N Unit N210
- 1231 5th Ave N Unit 101
- 1231 5th Ave N Unit 204
- 920 4th Ave N
- 555 Prospect St Unit 6
- 555 Prospect St Unit 3
- 555 Prospect St Unit 4
- 555 Prospect St Unit 2
- 555 Prospect St
- 1022 Taylor Ave N
- 1022A Taylor Ave N
- 1022 Taylor Ave N Unit A
- 1022 Taylor Ave N Unit B
- 1020 Taylor Ave N
- 1020 Taylor Ave N Unit A
- 1018 Taylor Ave N Unit A1
- 1018 Taylor Ave N
- 1018 Taylor Ave N Unit 1B
- 1018 Taylor Ave N Unit D
- 1018 Taylor Ave N Unit 1C
- 1018 Taylor Ave N Unit A
- 1018 Taylor Ave N Unit C
- 563 Prospect St