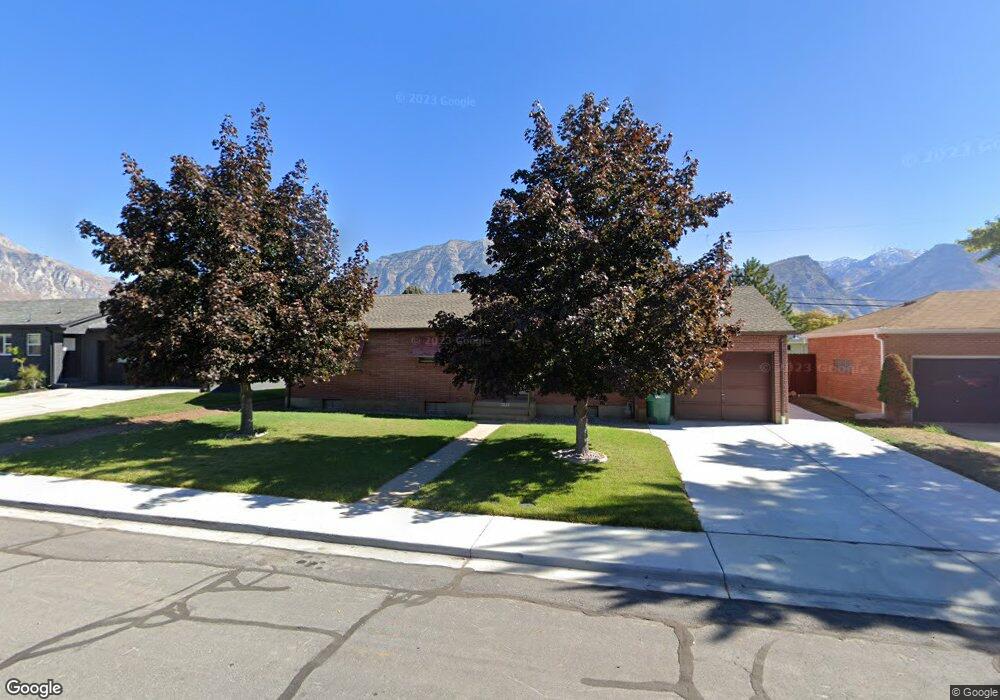
555 S 560 E Orem, UT 84097
SCERA NeighborhoodEstimated Value: $503,000 - $523,533
3
Beds
4
Baths
1,295
Sq Ft
$399/Sq Ft
Est. Value
About This Home
This home is located at 555 S 560 E, Orem, UT 84097 and is currently estimated at $516,511, approximately $398 per square foot. 555 S 560 E is a home located in Utah County with nearby schools including Centennial Elementary, Lakeridge Jr High School, and Orem High School.
Ownership History
Date
Name
Owned For
Owner Type
Purchase Details
Closed on
Apr 20, 2022
Sold by
Paul Knudsen Jr Larry
Bought by
Knudsen Connie
Current Estimated Value
Home Financials for this Owner
Home Financials are based on the most recent Mortgage that was taken out on this home.
Original Mortgage
$170,000
Outstanding Balance
$160,888
Interest Rate
5%
Mortgage Type
New Conventional
Estimated Equity
$355,623
Purchase Details
Closed on
Dec 16, 2021
Sold by
Paul Knudsen Jr Larry
Bought by
Knudsen Danny Lee
Purchase Details
Closed on
Sep 6, 2016
Sold by
Knudsen Connie Jo and The Knudsen Family Trust
Bought by
Knuden Larry P
Home Financials for this Owner
Home Financials are based on the most recent Mortgage that was taken out on this home.
Original Mortgage
$171,000
Interest Rate
3.45%
Mortgage Type
New Conventional
Purchase Details
Closed on
Aug 22, 2002
Sold by
Knudsen Omer C and Knudsen Tommye Marie
Bought by
Knudsen Omer C and Knudsen Tommye Marie
Create a Home Valuation Report for This Property
The Home Valuation Report is an in-depth analysis detailing your home's value as well as a comparison with similar homes in the area
Home Values in the Area
Average Home Value in this Area
Purchase History
| Date | Buyer | Sale Price | Title Company |
|---|---|---|---|
| Knudsen Connie | -- | Skyline Title | |
| Knudsen Danny Lee | -- | None Listed On Document | |
| Knuden Larry P | -- | Accommodation | |
| Knudsen Omer C | -- | First American Title Insuran |
Source: Public Records
Mortgage History
| Date | Status | Borrower | Loan Amount |
|---|---|---|---|
| Open | Knudsen Connie | $170,000 | |
| Previous Owner | Knuden Larry P | $171,000 |
Source: Public Records
Tax History
| Year | Tax Paid | Tax Assessment Tax Assessment Total Assessment is a certain percentage of the fair market value that is determined by local assessors to be the total taxable value of land and additions on the property. | Land | Improvement |
|---|---|---|---|---|
| 2025 | $1,742 | $240,240 | -- | -- |
| 2024 | $1,742 | $213,015 | $0 | $0 |
| 2023 | $1,560 | $205,040 | $0 | $0 |
| 2022 | $1,639 | $208,725 | $0 | $0 |
| 2021 | $1,523 | $293,700 | $127,300 | $166,400 |
| 2020 | $1,398 | $264,900 | $101,800 | $163,100 |
| 2019 | $1,295 | $255,300 | $95,100 | $160,200 |
| 2018 | $1,227 | $231,000 | $91,700 | $139,300 |
| 2017 | $1,222 | $123,310 | $0 | $0 |
| 2016 | $1,089 | $101,310 | $0 | $0 |
| 2015 | $1,134 | $99,770 | $0 | $0 |
| 2014 | $1,119 | $97,955 | $0 | $0 |
Source: Public Records
Map
Nearby Homes
Your Personal Tour Guide
Ask me questions while you tour the home.