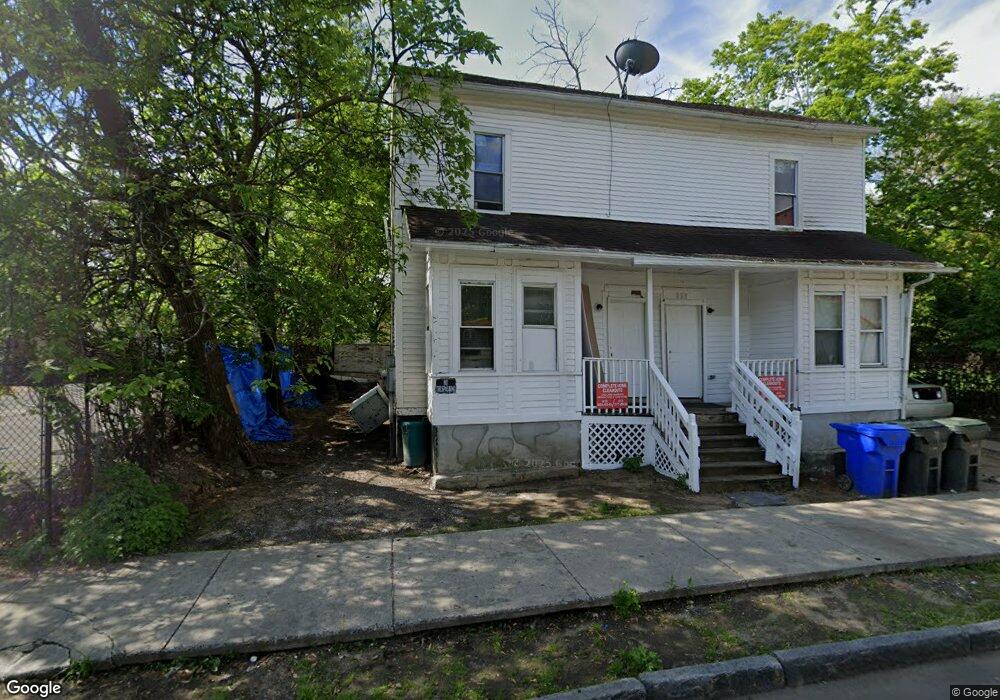
555 Union St Springfield, MA 01109
Old Hill NeighborhoodEstimated Value: $282,609 - $328,000
5
Beds
2
Baths
2,160
Sq Ft
$142/Sq Ft
Est. Value
About This Home
This home is located at 555 Union St, Springfield, MA 01109 and is currently estimated at $305,652, approximately $141 per square foot. 555 Union St is a home located in Hampden County with nearby schools including William N. DeBerry Elementary School, M Marcus Kiley Middle, and High School Of Commerce.
Ownership History
Date
Name
Owned For
Owner Type
Purchase Details
Closed on
Mar 4, 2011
Sold by
Brown Lee and Brown Tamara
Bought by
Springfield City Of
Current Estimated Value
Purchase Details
Closed on
Jun 15, 2009
Sold by
Brown Tamara and Brown Lee
Bought by
Brown Lee
Purchase Details
Closed on
Mar 22, 2004
Sold by
Brown Tamara
Bought by
Brown Lee and Brown Tamara
Purchase Details
Closed on
Jun 23, 2003
Sold by
Brown Lee
Bought by
Brown Tamara
Purchase Details
Closed on
Oct 9, 2002
Sold by
Davis Sharon
Bought by
Brown Lee
Purchase Details
Closed on
Sep 5, 2001
Sold by
Williams Charles L
Bought by
Davis Shaorn
Purchase Details
Closed on
May 17, 2001
Sold by
Brown Lee
Bought by
Williams Charles L
Purchase Details
Closed on
Aug 9, 1988
Sold by
Est Addis Ayers
Bought by
Romeo Pasquale A
Create a Home Valuation Report for This Property
The Home Valuation Report is an in-depth analysis detailing your home's value as well as a comparison with similar homes in the area
Home Values in the Area
Average Home Value in this Area
Purchase History
| Date | Buyer | Sale Price | Title Company |
|---|---|---|---|
| Springfield City Of | -- | -- | |
| Brown Lee | -- | -- | |
| Brown Lee | -- | -- | |
| Brown Tamara | $1,000 | -- | |
| Brown Lee | $1,000 | -- | |
| Davis Shaorn | $1,000 | -- | |
| Williams Charles L | $1,000 | -- | |
| Romeo Pasquale A | $28,500 | -- |
Source: Public Records
Mortgage History
| Date | Status | Borrower | Loan Amount |
|---|---|---|---|
| Previous Owner | Romeo Pasquale A | $108,000 |
Source: Public Records
Tax History
| Year | Tax Paid | Tax Assessment Tax Assessment Total Assessment is a certain percentage of the fair market value that is determined by local assessors to be the total taxable value of land and additions on the property. | Land | Improvement |
|---|---|---|---|---|
| 2025 | $3,043 | $194,100 | $25,400 | $168,700 |
| 2024 | $2,624 | $163,400 | $23,800 | $139,600 |
| 2023 | $2,290 | $134,300 | $22,600 | $111,700 |
| 2022 | $2,829 | $150,300 | $20,600 | $129,700 |
| 2021 | $2,572 | $136,100 | $18,700 | $117,400 |
| 2020 | $2,480 | $127,000 | $18,700 | $108,300 |
| 2019 | $2,470 | $125,500 | $18,700 | $106,800 |
| 2018 | $2,275 | $115,600 | $18,700 | $96,900 |
| 2017 | $2,310 | $117,500 | $15,000 | $102,500 |
| 2016 | $1,921 | $97,700 | $15,000 | $82,700 |
| 2015 | -- | $95,000 | $15,000 | $80,000 |
Source: Public Records
Map
Nearby Homes
- 52 Quincy St Unit 56
- 48 Quincy St Unit 50
- 68 Quincy St
- 68 Quincy St Unit 2
- 540 Union St Unit 542
- 536 Union St Unit 538
- 550 Union St Unit 552
- 82 Stebbins St
- 62 Stebbins St
- 51 Quincy St
- 57 Quincy St
- 91 Orleans St
- 34 Quincy St Unit 1
- 53 Orleans St Unit 55
- 53-55 Orleans St
- 93 Orleans St Unit 93
- 63 Quincy St
- 524 Union St
- 49 Orleans St
- 30 Quincy St Unit 2
Your Personal Tour Guide
Ask me questions while you tour the home.