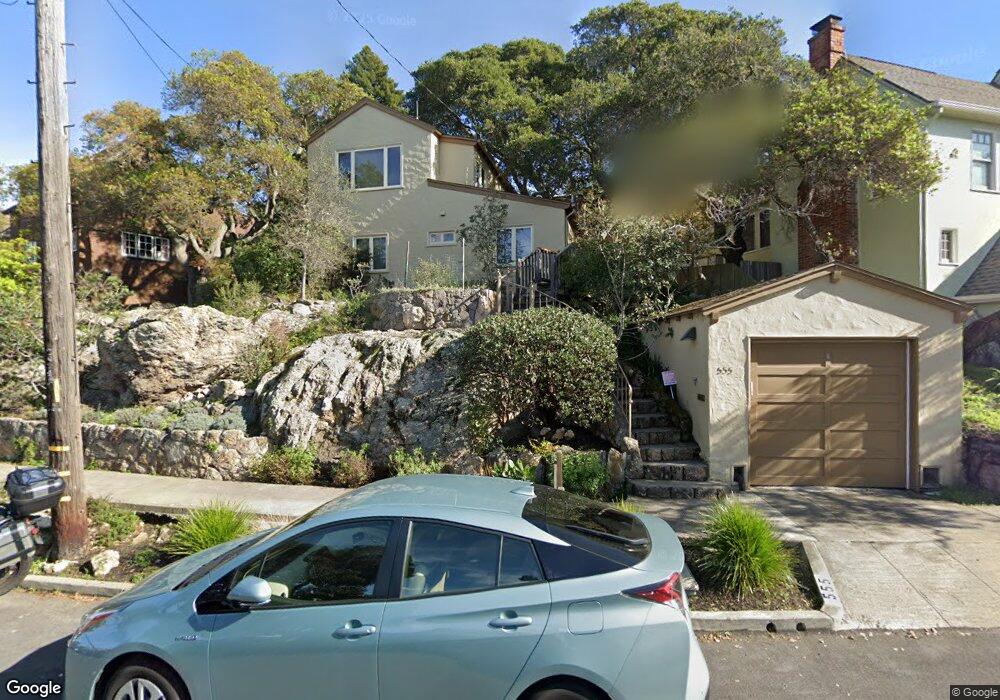
555 Vincente Ave Berkeley, CA 94707
Thousand Oaks NeighborhoodEstimated Value: $1,580,361 - $1,953,000
2
Beds
1
Bath
1,932
Sq Ft
$901/Sq Ft
Est. Value
About This Home
This home is located at 555 Vincente Ave, Berkeley, CA 94707 and is currently estimated at $1,740,840, approximately $901 per square foot. 555 Vincente Ave is a home located in Alameda County with nearby schools including Thousand Oaks Elementary School, Ruth Acty Elementary, and Berkeley Arts Magnet at Whittier School.
Ownership History
Date
Name
Owned For
Owner Type
Purchase Details
Closed on
Jul 1, 2020
Sold by
Quint Richard and Quint Richard
Bought by
Quint Richard and Quint Richard
Current Estimated Value
Home Financials for this Owner
Home Financials are based on the most recent Mortgage that was taken out on this home.
Original Mortgage
$65,500
Interest Rate
3.1%
Mortgage Type
New Conventional
Purchase Details
Closed on
Dec 17, 2015
Sold by
Quint Richard and Quint Richard
Bought by
Quint Richard and Richard Quint Trust
Purchase Details
Closed on
May 18, 2004
Sold by
Bell Quint Richard David and Bell Quint Julia
Bought by
Bell Quint Richard and Bell Quint Julia
Create a Home Valuation Report for This Property
The Home Valuation Report is an in-depth analysis detailing your home's value as well as a comparison with similar homes in the area
Home Values in the Area
Average Home Value in this Area
Purchase History
| Date | Buyer | Sale Price | Title Company |
|---|---|---|---|
| Quint Richard | -- | Old Republic Title Company | |
| Quint Richard | -- | None Available | |
| Bell Quint Richard | -- | -- |
Source: Public Records
Mortgage History
| Date | Status | Borrower | Loan Amount |
|---|---|---|---|
| Closed | Quint Richard | $65,500 |
Source: Public Records
Tax History
| Year | Tax Paid | Tax Assessment Tax Assessment Total Assessment is a certain percentage of the fair market value that is determined by local assessors to be the total taxable value of land and additions on the property. | Land | Improvement |
|---|---|---|---|---|
| 2025 | $7,875 | $279,657 | $134,920 | $151,737 |
| 2024 | $7,875 | $274,036 | $132,274 | $148,762 |
| 2023 | $7,618 | $275,526 | $129,681 | $145,845 |
| 2022 | $7,346 | $263,124 | $127,138 | $142,986 |
| 2021 | $7,314 | $257,828 | $124,646 | $140,182 |
| 2020 | $6,776 | $262,113 | $123,368 | $138,745 |
| 2019 | $6,340 | $256,974 | $120,949 | $136,025 |
| 2018 | $6,177 | $251,936 | $118,578 | $133,358 |
| 2017 | $5,938 | $246,996 | $116,253 | $130,743 |
| 2016 | $5,617 | $242,154 | $113,974 | $128,180 |
| 2015 | $5,513 | $238,517 | $112,262 | $126,255 |
| 2014 | $5,366 | $233,845 | $110,063 | $123,782 |
Source: Public Records
Map
Nearby Homes
- 491 Vincente Ave
- 415 Berkeley Park Blvd
- 1858 San Lorenzo Ave
- 753 Peralta Ave
- 118 Ramona Ave
- 145 Ramona Ave
- 1983 Yosemite Rd
- 589 San Luis Rd
- 483 Boynton Ave
- 450 Vermont Ave
- 765 San Diego Rd
- 380 Vermont Ave
- 1266 Washington Ave
- 712 Masonic Ave
- 840 Key Route Blvd
- 417 Evelyn Ave Unit 205
- 813 San Diego Rd
- 201 Amherst Ave
- 1236 Portland Ave
- 255 Stanford Ave
- 547 Vincente Ave
- 563 Vincente Ave
- 543 Vincente Ave
- 571 Vincente Ave
- 27 Menlo Place
- 533 Vincente Ave
- 25 Menlo Place
- 575 Vincente Ave
- 548 Vincente Ave
- 544 Vincente Ave
- 31 Menlo Place
- 556 Vincente Ave
- 560 Vincente Ave
- 552 Vincente Ave
- 531 Vincente Ave
- 21 Menlo Place
- 538 Vincente Ave
- 566 Vincente Ave
- 579 Vincente Ave
- 574 Vincente Ave
Your Personal Tour Guide
Ask me questions while you tour the home.