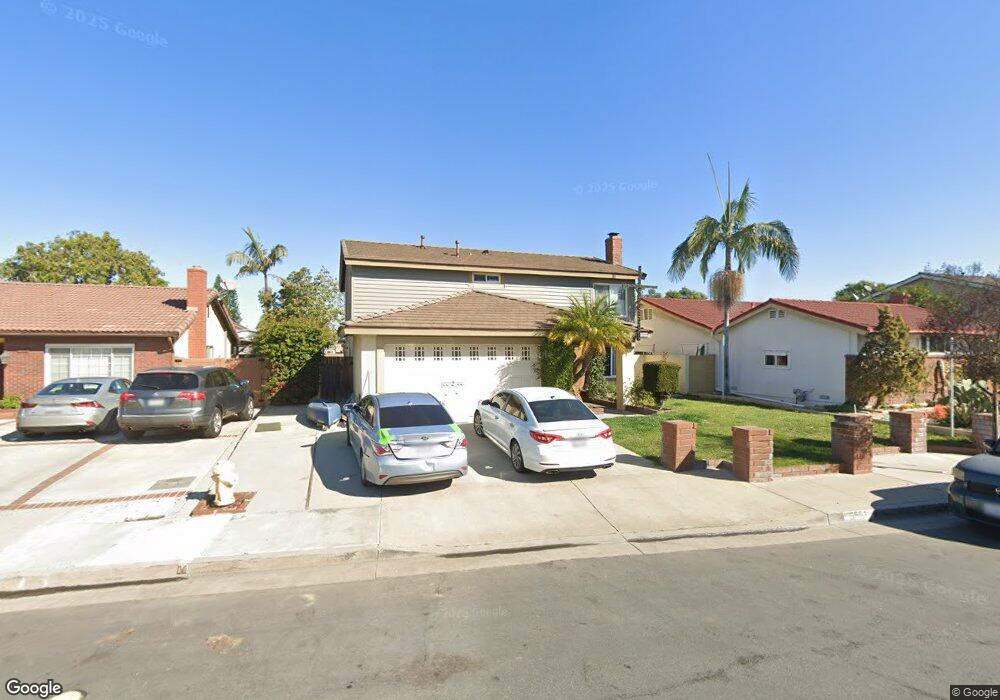
5551 Citrus Ct Cypress, CA 90630
Estimated Value: $1,129,831 - $1,289,000
4
Beds
4
Baths
1,980
Sq Ft
$610/Sq Ft
Est. Value
About This Home
This home is located at 5551 Citrus Ct, Cypress, CA 90630 and is currently estimated at $1,208,458, approximately $610 per square foot. 5551 Citrus Ct is a home located in Orange County with nearby schools including Juliet Morris Elementary School, Lexington Junior High School, and Cypress High School.
Ownership History
Date
Name
Owned For
Owner Type
Purchase Details
Closed on
Apr 9, 2002
Sold by
Shanahan Joe R and Shanahan Kathleen G
Bought by
Shanahan Joe R and Shanahan Kathleen G
Current Estimated Value
Home Financials for this Owner
Home Financials are based on the most recent Mortgage that was taken out on this home.
Original Mortgage
$341,250
Outstanding Balance
$142,776
Interest Rate
6.94%
Mortgage Type
Stand Alone First
Estimated Equity
$1,065,682
Purchase Details
Closed on
Jun 30, 1997
Sold by
Ladow James R and Ladow Judith A
Bought by
Barrett Thomas and Barrett Otilia
Home Financials for this Owner
Home Financials are based on the most recent Mortgage that was taken out on this home.
Original Mortgage
$223,250
Interest Rate
7.57%
Create a Home Valuation Report for This Property
The Home Valuation Report is an in-depth analysis detailing your home's value as well as a comparison with similar homes in the area
Home Values in the Area
Average Home Value in this Area
Purchase History
| Date | Buyer | Sale Price | Title Company |
|---|---|---|---|
| Shanahan Joe R | -- | American Title Co | |
| Shanahan Joe R | $385,000 | American Title Co | |
| Barrett Thomas | $235,000 | North American Title Co |
Source: Public Records
Mortgage History
| Date | Status | Borrower | Loan Amount |
|---|---|---|---|
| Open | Shanahan Joe R | $341,250 | |
| Previous Owner | Barrett Thomas | $223,250 |
Source: Public Records
Tax History
| Year | Tax Paid | Tax Assessment Tax Assessment Total Assessment is a certain percentage of the fair market value that is determined by local assessors to be the total taxable value of land and additions on the property. | Land | Improvement |
|---|---|---|---|---|
| 2025 | $6,525 | $576,126 | $394,687 | $181,439 |
| 2024 | $6,525 | $564,830 | $386,948 | $177,882 |
| 2023 | $6,376 | $553,755 | $379,360 | $174,395 |
| 2022 | $6,304 | $542,898 | $371,922 | $170,976 |
| 2021 | $6,222 | $532,253 | $364,629 | $167,624 |
| 2020 | $6,198 | $526,796 | $360,890 | $165,906 |
| 2019 | $6,024 | $516,467 | $353,814 | $162,653 |
| 2018 | $5,943 | $506,341 | $346,877 | $159,464 |
| 2017 | $5,739 | $496,413 | $340,075 | $156,338 |
| 2016 | $5,692 | $486,680 | $333,407 | $153,273 |
| 2015 | $5,652 | $479,370 | $328,399 | $150,971 |
| 2014 | $5,287 | $463,963 | $321,967 | $141,996 |
Source: Public Records
Map
Nearby Homes
- 5372 Harvard Way
- 5342 Bishop St
- 9001 Cerise Ln Unit 109
- 9001 Cerise Ln Unit 113
- 9011 Cerise Ln Unit 129
- 6007 Clementine Ln Unit 21
- 5353 Cumberland Dr
- 5475 Twin Lakes Dr
- 5000 Clementine Ln
- 5447 Twin Lakes Dr
- 9598 Naples Dr
- 5572 Saint Ann Ave
- 9948 Del Rio Way Unit 98
- 8792 Grindlay St
- 5930 Los Nietos St
- 5482 Myra Ave
- 4790 Montefino Dr
- 4811 Newman Ave
- 8792 Valley View St Unit B
- 9031 Primavera Ln
Your Personal Tour Guide
Ask me questions while you tour the home.