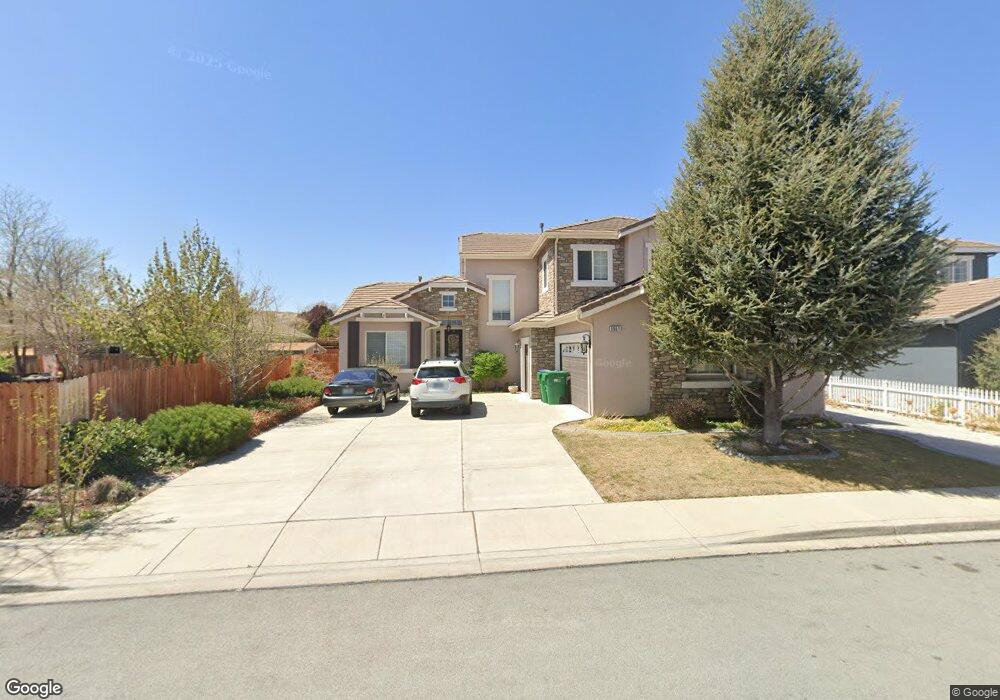
5551 Junction Peak Dr Unit 2 Sparks, NV 89436
Sparks Galleria NeighborhoodEstimated Value: $632,593 - $706,000
4
Beds
3
Baths
2,813
Sq Ft
$236/Sq Ft
Est. Value
About This Home
This home is located at 5551 Junction Peak Dr Unit 2, Sparks, NV 89436 and is currently estimated at $663,898, approximately $236 per square foot. 5551 Junction Peak Dr Unit 2 is a home located in Washoe County with nearby schools including Miguel Sepulveda Elementary School, Sky Ranch Middle School, and Edward C Reed High School.
Ownership History
Date
Name
Owned For
Owner Type
Purchase Details
Closed on
Sep 12, 2011
Sold by
Smith Shaun A and Smith Kathie J
Bought by
Lucero Jane F
Current Estimated Value
Home Financials for this Owner
Home Financials are based on the most recent Mortgage that was taken out on this home.
Original Mortgage
$223,880
Outstanding Balance
$153,238
Interest Rate
4.25%
Mortgage Type
FHA
Estimated Equity
$510,660
Purchase Details
Closed on
Nov 17, 2003
Sold by
R & K Homes Kiley Ranch Ii Llc
Bought by
Smith Shaun A and Smith Kathie J
Home Financials for this Owner
Home Financials are based on the most recent Mortgage that was taken out on this home.
Original Mortgage
$212,200
Interest Rate
5.72%
Mortgage Type
Unknown
Create a Home Valuation Report for This Property
The Home Valuation Report is an in-depth analysis detailing your home's value as well as a comparison with similar homes in the area
Home Values in the Area
Average Home Value in this Area
Purchase History
| Date | Buyer | Sale Price | Title Company |
|---|---|---|---|
| Lucero Jane F | $232,000 | Ticor Title Reno Lakeside | |
| Smith Shaun A | $725,700 | First American Title |
Source: Public Records
Mortgage History
| Date | Status | Borrower | Loan Amount |
|---|---|---|---|
| Open | Lucero Jane F | $223,880 | |
| Previous Owner | Smith Shaun A | $212,200 | |
| Closed | Smith Shaun A | $53,000 |
Source: Public Records
Tax History Compared to Growth
Tax History
| Year | Tax Paid | Tax Assessment Tax Assessment Total Assessment is a certain percentage of the fair market value that is determined by local assessors to be the total taxable value of land and additions on the property. | Land | Improvement |
|---|---|---|---|---|
| 2025 | $3,291 | $160,828 | $38,465 | $122,363 |
| 2024 | $3,194 | $156,834 | $33,950 | $122,884 |
| 2023 | $3,194 | $155,131 | $38,780 | $116,351 |
| 2022 | $3,104 | $126,112 | $29,155 | $96,957 |
| 2021 | $3,012 | $121,513 | $25,025 | $96,488 |
| 2020 | $2,923 | $121,286 | $24,675 | $96,611 |
| 2019 | $2,840 | $117,051 | $23,940 | $93,111 |
| 2018 | $2,758 | $109,188 | $18,270 | $90,918 |
| 2017 | $2,677 | $108,691 | $17,710 | $90,981 |
| 2016 | $2,610 | $107,207 | $15,505 | $91,702 |
| 2015 | $2,605 | $104,805 | $13,545 | $91,260 |
| 2014 | $2,531 | $91,572 | $12,740 | $78,832 |
| 2013 | -- | $67,661 | $9,415 | $58,246 |
Source: Public Records
Map
Nearby Homes
- 601 W Equinox Peak Ct
- 601 W Equinox Peak Ct Unit Homesite 2030
- 6920 Pah Rah Dr
- 5651 Hunting Creek Way
- 5365 Ebbetts Pass Dr
- 6835 Summit View Dr
- 6835 Pah Rah Dr
- 2084 Great Bluffs Ln Unit Homesite 5132
- 2094 Great Bluffs Ln Unit Homesite 5133
- 7129 Singing Tree Rd Unit Homesite 5121
- 585 Sonora Pass Ct
- 801 Pinchot Pass Ct Unit 7
- 811 Pinchot Pass Ct Unit 5
- 6671 April St
- 6560 Pyramid Way Unit 52
- 7290 Pah Rah Dr
- 521 E Equinox Peak Ct
- 521 E Equinox Peak Ct Unit Homesite 2038
- 532 E Equinox Peak Ct Unit Homesite 2045
- 551 E Equinox Peak Ct
- 5555 Junction Peak Dr Unit 2
- 616 Junction Peak Ct
- 606 Junction Peak Ct
- 5559 Junction Peak Dr Unit 2
- 5552 Junction Peak Dr
- 5548 Junction Peak Dr
- 5556 Junction Peak Dr
- 700 Blue Skies Dr
- 690 Blue Skies Dr
- 5544 Junction Peak Dr
- 680 Blue Skies Dr
- 710 Blue Skies Dr
- 5563 Junction Peak Dr
- 720 Blue Skies Dr
- 617 Junction Peak Ct Unit 2
- 5540 Junction Peak Dr
- 5567 Junction Peak Dr
- 670 Blue Skies Dr
- 100 Pah Rah Springs Rd
- 660 Blue Skies Dr