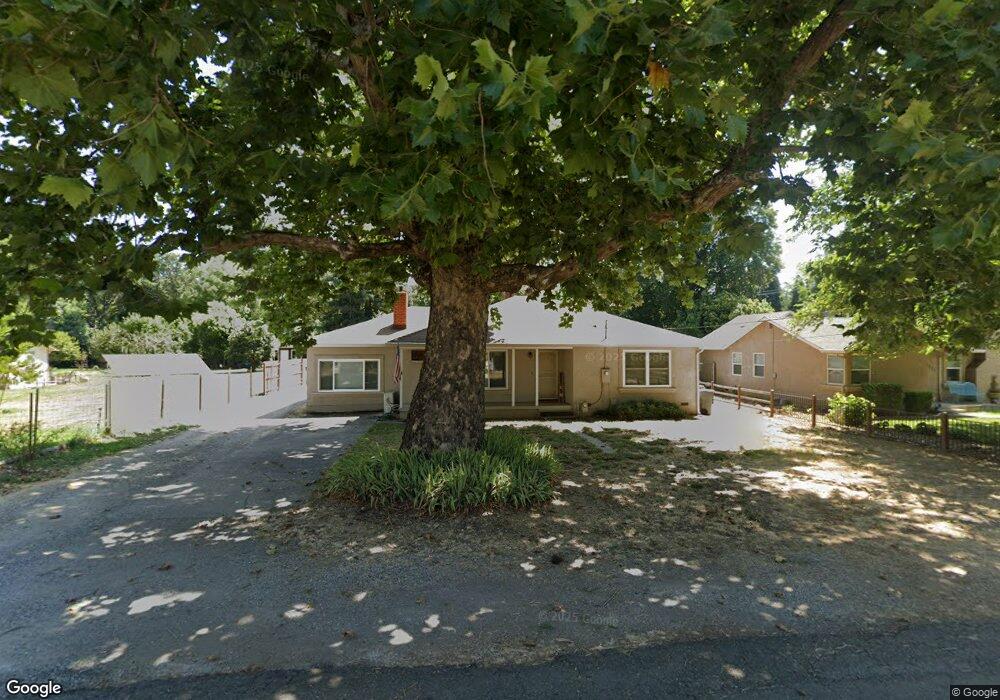
5551 Willow Rd Redding, CA 96001
Bonnyview NeighborhoodEstimated Value: $318,014 - $369,000
3
Beds
2
Baths
1,502
Sq Ft
$230/Sq Ft
Est. Value
About This Home
This home is located at 5551 Willow Rd, Redding, CA 96001 and is currently estimated at $345,754, approximately $230 per square foot. 5551 Willow Rd is a home located in Shasta County with nearby schools including Bonny View Elementary School, Sequoia Middle School, and Shasta High School.
Ownership History
Date
Name
Owned For
Owner Type
Purchase Details
Closed on
Sep 20, 2018
Sold by
Lund Ronnean and Mandell Ronnean
Bought by
Lund Ronnean
Current Estimated Value
Home Financials for this Owner
Home Financials are based on the most recent Mortgage that was taken out on this home.
Original Mortgage
$35,000
Interest Rate
4.5%
Mortgage Type
Stand Alone Second
Purchase Details
Closed on
Sep 11, 2015
Sold by
Mandell Ronnean and Lund Ronnean
Bought by
Mandell Ronnean
Home Financials for this Owner
Home Financials are based on the most recent Mortgage that was taken out on this home.
Original Mortgage
$155,000
Interest Rate
3.86%
Mortgage Type
New Conventional
Purchase Details
Closed on
Dec 7, 2009
Sold by
Boatner Ronald W and Boatner Dennis L
Bought by
Lund Ronnean
Home Financials for this Owner
Home Financials are based on the most recent Mortgage that was taken out on this home.
Original Mortgage
$144,485
Interest Rate
4.3%
Mortgage Type
FHA
Purchase Details
Closed on
Jun 4, 2008
Sold by
Boatner Florine E
Bought by
Boatner Ronald W and Boatner Dennis L
Create a Home Valuation Report for This Property
The Home Valuation Report is an in-depth analysis detailing your home's value as well as a comparison with similar homes in the area
Home Values in the Area
Average Home Value in this Area
Purchase History
| Date | Buyer | Sale Price | Title Company |
|---|---|---|---|
| Lund Ronnean | -- | Placer Title Co | |
| Mandell Ronnean | -- | Fidelity Natl Title Co Of Ca | |
| Lund Ronnean | $158,000 | Fidelity Natl Title Co Of Ca | |
| Boatner Ronald W | -- | None Available |
Source: Public Records
Mortgage History
| Date | Status | Borrower | Loan Amount |
|---|---|---|---|
| Closed | Lund Ronnean | $35,000 | |
| Closed | Mandell Ronnean | $155,000 | |
| Closed | Lund Ronnean | $144,485 |
Source: Public Records
Tax History
| Year | Tax Paid | Tax Assessment Tax Assessment Total Assessment is a certain percentage of the fair market value that is determined by local assessors to be the total taxable value of land and additions on the property. | Land | Improvement |
|---|---|---|---|---|
| 2025 | $2,050 | $203,675 | $77,441 | $126,234 |
| 2024 | $2,017 | $199,682 | $75,923 | $123,759 |
| 2023 | $2,017 | $195,768 | $74,435 | $121,333 |
| 2022 | $1,982 | $191,930 | $72,976 | $118,954 |
| 2021 | $1,971 | $188,168 | $71,546 | $116,622 |
| 2020 | $1,996 | $186,240 | $70,813 | $115,427 |
| 2019 | $1,893 | $182,589 | $69,425 | $113,164 |
| 2018 | $1,909 | $179,010 | $68,064 | $110,946 |
| 2017 | $1,897 | $175,501 | $66,730 | $108,771 |
| 2016 | $1,835 | $172,061 | $65,422 | $106,639 |
| 2015 | $1,811 | $169,478 | $64,440 | $105,038 |
| 2014 | $1,618 | $150,000 | $45,000 | $105,000 |
Source: Public Records
Map
Nearby Homes
- 5782 Old Barn Way
- 5875 Farm House Ln
- 3232 Nicolet Ln
- 5730 E Bonnyview Rd
- 3500 Pioneer Ln
- 5443 Rosswood St
- 5367 Rosswood Ln
- 3857 Eagle Pkwy
- 2381 S Bonnyview Rd
- 4920 Bonnyview Ave
- 4540 Cerro Ln
- 2340 Wilsey Dr
- 5812 Cedars Rd Unit 43
- 5812 Cedars Rd Unit 13
- 5812 Cedars Rd Unit 36
- 5812 Cedars Rd Unit 3
- 2850 Balaton Ave
- 2521 Radio Ln
- 2890 Balaton Ave
- 2200 Jewell Ln
- 5561 Willow Rd
- 5521 Willow Rd
- 5570 Willow Rd
- 5550 Willow Rd
- 5536 Willow Rd
- 5591 Willow Rd
- 3190 Pioneer Ln
- 3124 Pioneer Ln
- 5510 Willow Rd
- 5501 Willow Rd
- 3140 Pioneer Ln
- 5500 Willow Rd
- 3105 Willowbrae Ave
- 3183 Pioneer Ln
- 3201 Pioneer Ln
- 5610 Kofford Ln
- 3106 Willowbrae Ave
- 5561 E Bonnyview Rd
- 3221 Pioneer Ln
- 5477 Willow Rd
Your Personal Tour Guide
Ask me questions while you tour the home.