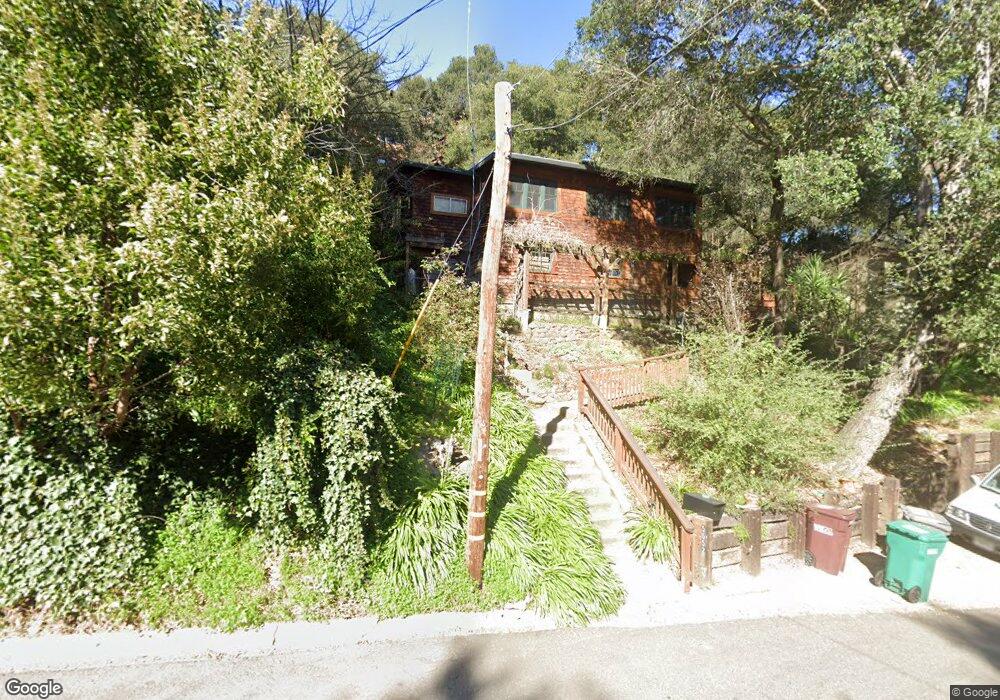
5552 Merriewood Dr Oakland, CA 94611
Merriewood NeighborhoodEstimated Value: $907,000 - $1,147,000
2
Beds
1
Bath
1,404
Sq Ft
$710/Sq Ft
Est. Value
About This Home
This home is located at 5552 Merriewood Dr, Oakland, CA 94611 and is currently estimated at $997,202, approximately $710 per square foot. 5552 Merriewood Dr is a home located in Alameda County with nearby schools including Thornhill Elementary School, Montera Middle School, and Skyline High School.
Ownership History
Date
Name
Owned For
Owner Type
Purchase Details
Closed on
Nov 28, 2023
Sold by
Elizabeth A Berry Living Trust
Bought by
Obrien James and Engelson Mara
Current Estimated Value
Home Financials for this Owner
Home Financials are based on the most recent Mortgage that was taken out on this home.
Original Mortgage
$855,000
Outstanding Balance
$841,158
Interest Rate
7.63%
Mortgage Type
New Conventional
Estimated Equity
$156,044
Purchase Details
Closed on
Jan 23, 2019
Sold by
Berry Elizabeth A
Bought by
Berry Elizabeth A and Elizabeth A Berry Living Trust
Purchase Details
Closed on
Oct 9, 2009
Sold by
Ashton Jon Lloyd
Bought by
Berry Elizabeth A
Home Financials for this Owner
Home Financials are based on the most recent Mortgage that was taken out on this home.
Original Mortgage
$79,500
Interest Rate
5.02%
Mortgage Type
New Conventional
Create a Home Valuation Report for This Property
The Home Valuation Report is an in-depth analysis detailing your home's value as well as a comparison with similar homes in the area
Home Values in the Area
Average Home Value in this Area
Purchase History
| Date | Buyer | Sale Price | Title Company |
|---|---|---|---|
| Obrien James | $900,000 | Old Republic Title Company | |
| Berry Elizabeth A | -- | None Available | |
| Berry Elizabeth A | -- | First American Title Lenders |
Source: Public Records
Mortgage History
| Date | Status | Borrower | Loan Amount |
|---|---|---|---|
| Open | Obrien James | $855,000 | |
| Previous Owner | Berry Elizabeth A | $79,500 |
Source: Public Records
Tax History
| Year | Tax Paid | Tax Assessment Tax Assessment Total Assessment is a certain percentage of the fair market value that is determined by local assessors to be the total taxable value of land and additions on the property. | Land | Improvement |
|---|---|---|---|---|
| 2025 | $13,195 | $911,000 | $275,400 | $642,600 |
| 2024 | $13,195 | $893,000 | $270,000 | $630,000 |
| 2023 | $5,424 | $282,578 | $177,052 | $105,526 |
| 2022 | $5,225 | $270,038 | $173,581 | $103,457 |
| 2021 | $5,128 | $264,605 | $170,177 | $101,428 |
| 2020 | $5,068 | $268,822 | $168,433 | $100,389 |
| 2019 | $4,816 | $263,551 | $165,131 | $98,420 |
| 2018 | $4,715 | $258,384 | $161,893 | $96,491 |
| 2017 | $4,511 | $253,318 | $158,719 | $94,599 |
| 2016 | $4,302 | $248,352 | $155,607 | $92,745 |
| 2015 | $4,274 | $244,622 | $153,270 | $91,352 |
| 2014 | $4,202 | $239,832 | $150,269 | $89,563 |
Source: Public Records
Map
Nearby Homes
- 5900 Marden Ln
- 5914 Thornhill Dr
- 6165 Doncaster Place
- 6406 Valley View Rd
- 268 Capricorn Ave
- 6070 Mazuela Dr
- 6194 Mazuela Dr
- 104 Capricorn Ave
- 6257 Virgo Rd
- 233 Capricorn Ave
- 6002 Mazuela Dr
- 6507 Heather Ridge Way
- 6411 Snake Rd
- 1101 Mountain Blvd
- 6344 Snake Rd
- 6842 Armour Dr
- 0 Thorndale Dr Unit 41115333
- 936 Mountain Blvd
- 6357 Fairlane Dr
- 15010 Broadway Terrace
- 5544 Merriewood Dr
- 5558 Merriewood Dr
- 6034 Valley View Rd
- 6040 Valley View Rd
- 5945 Marden Ln
- 5549 Merriewood Dr
- 6004 Valley View Rd
- 5534 Merriewood Dr
- 5557 Merriewood Dr
- 6018 Valley View Rd
- 5573 Merriewood Dr
- 6048 Valley View Rd
- 5944 Marden Ln
- 5939 Marden Ln
- 5545 Merriewood Dr
- 6037 Valley View Rd
- 6043 Valley View Rd
- 5531 Merriewood Dr
- 5969 Thornhill Dr
- 6056 Valley View Rd
Your Personal Tour Guide
Ask me questions while you tour the home.