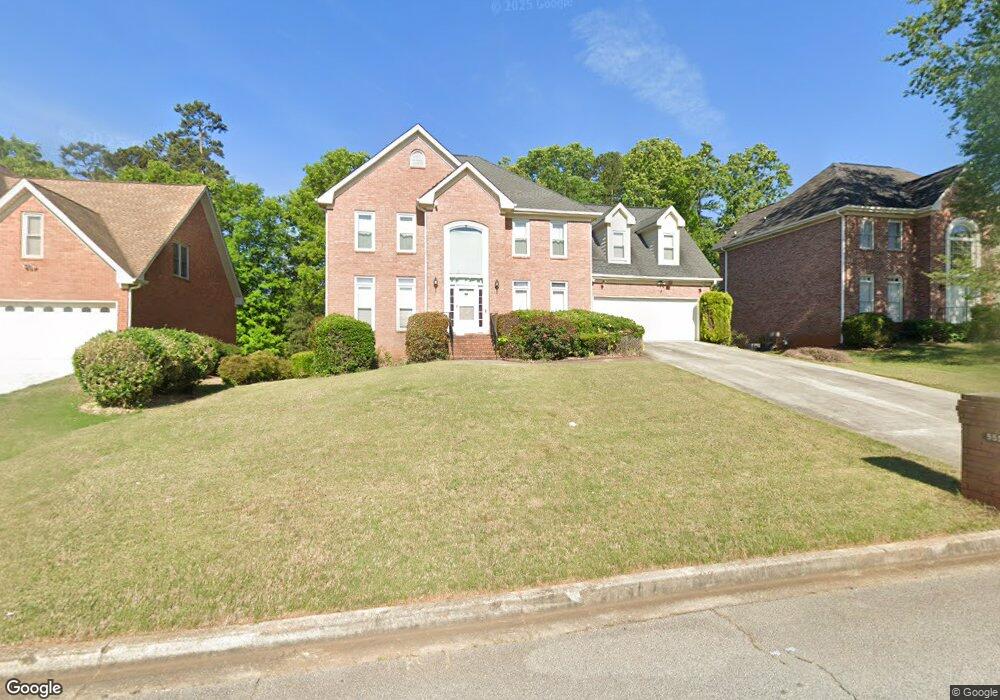
5553 Mountain View Pass Stone Mountain, GA 30087
Estimated Value: $346,082 - $416,000
4
Beds
3
Baths
2,517
Sq Ft
$153/Sq Ft
Est. Value
About This Home
This home is located at 5553 Mountain View Pass, Stone Mountain, GA 30087 and is currently estimated at $384,271, approximately $152 per square foot. 5553 Mountain View Pass is a home located in DeKalb County with nearby schools including Shadow Rock Elementary School, Redan Middle School, and Redan High School.
Ownership History
Date
Name
Owned For
Owner Type
Purchase Details
Closed on
May 22, 2012
Sold by
Clarke Yemane
Bought by
The Yemane & Shanelle Clarke R
Current Estimated Value
Purchase Details
Closed on
Oct 10, 2008
Sold by
Indymac Fedl Bk Fsb
Bought by
Clarke Yemane K
Home Financials for this Owner
Home Financials are based on the most recent Mortgage that was taken out on this home.
Original Mortgage
$147,250
Interest Rate
6.36%
Mortgage Type
New Conventional
Purchase Details
Closed on
Jan 2, 2008
Sold by
Rose Glenn G and Rose Cynthia M
Bought by
Indymac Bank Fsb
Purchase Details
Closed on
Feb 3, 2003
Sold by
Johnson Larry and Johnson Rosalean
Bought by
Rose Cynthia M and Rose Glenn G
Home Financials for this Owner
Home Financials are based on the most recent Mortgage that was taken out on this home.
Original Mortgage
$202,320
Interest Rate
5.95%
Mortgage Type
New Conventional
Create a Home Valuation Report for This Property
The Home Valuation Report is an in-depth analysis detailing your home's value as well as a comparison with similar homes in the area
Home Values in the Area
Average Home Value in this Area
Purchase History
| Date | Buyer | Sale Price | Title Company |
|---|---|---|---|
| The Yemane & Shanelle Clarke R | -- | -- | |
| Clarke Yemane K | $155,000 | -- | |
| Indymac Fedl Bk Fsb | -- | -- | |
| Indymac Bank Fsb | $218,700 | -- | |
| Rose Cynthia M | $252,900 | -- |
Source: Public Records
Mortgage History
| Date | Status | Borrower | Loan Amount |
|---|---|---|---|
| Previous Owner | Indymac Fedl Bk Fsb | $147,250 | |
| Previous Owner | Rose Cynthia M | $202,320 |
Source: Public Records
Tax History
| Year | Tax Paid | Tax Assessment Tax Assessment Total Assessment is a certain percentage of the fair market value that is determined by local assessors to be the total taxable value of land and additions on the property. | Land | Improvement |
|---|---|---|---|---|
| 2025 | $3,964 | $145,960 | $18,000 | $127,960 |
| 2024 | $4,068 | $146,840 | $18,000 | $128,840 |
| 2023 | $4,068 | $143,920 | $18,000 | $125,920 |
Source: Public Records
Map
Nearby Homes
- 758 S Stone Mountain Lithonia Rd
- 5581 Shadow Rock Dr
- 743 Mountain Meadow Walk
- 759 Greenhedge Dr
- 5690 Shadow Rock Dr
- 5450 Fox Haven Trail
- 708 Greenhedge Dr Unit 3A
- 5407 Post Road Pass
- 826 Greenhedge Way Unit 2
- 915 Fox Valley Ct
- 854 Greenhedge Dr
- 937 Fox Valley Ct
- 922 Fox Valley Ct
- 703 Kingsgate Ridge
- 868 Greenhedge Dr Unit 2
- 5651 Wells Cir
- 884 Forest Path
- 5722 Wells Cir
- 789 Rutland Ct
- 5743 Wells Cir
- 5559 Mountain View Pass
- 5545 Mountain View Pass
- 5565 Mountain View Pass
- 5539 Mountain View Pass
- 5556 Mountain View Pass
- 5550 Mountain View Pass Unit 5
- 5570 Mountain View Pass Unit V
- 5533 Mountain View Pass
- 5569 Mountain View Pass Unit 5
- 5598 Mountain View Point Unit 5
- 5588 Mountain View Pass
- 5605 Mountain View Point
- 5532 Mountain View Pass
- 5532 Mountain View Pass Unit 5
- 5532 Mountain View Pass Unit 22
- 5527 Mountain View Pass
- 5594 Mountain View Pass
- 5571 Mountain View Pass
- 5575 Mountain View Pass
- 5514 Mountain View Summit
Your Personal Tour Guide
Ask me questions while you tour the home.