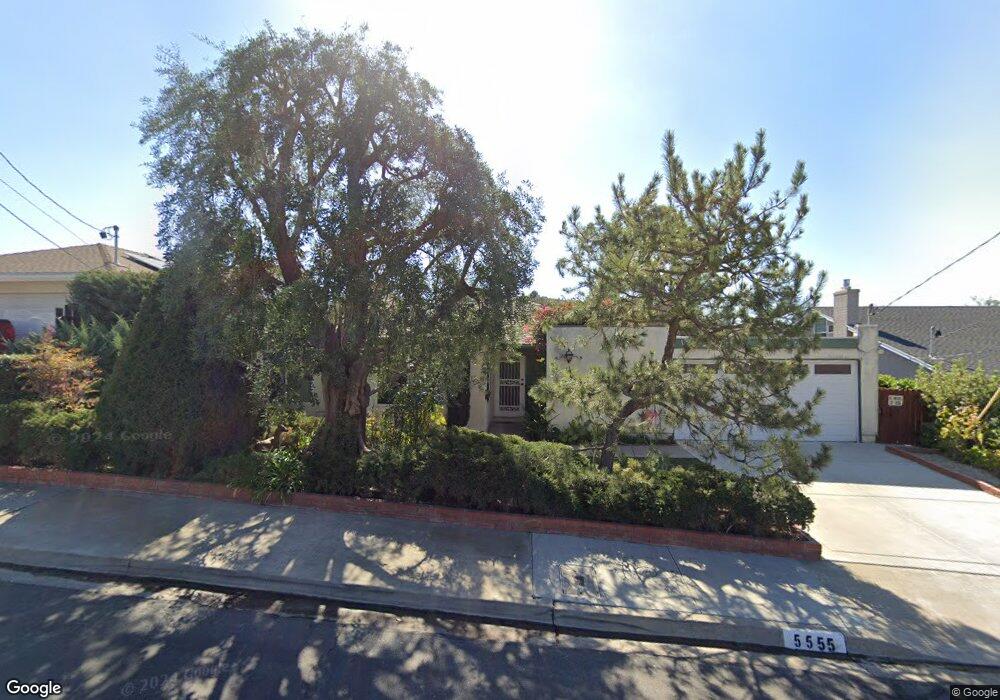
5555 Laramie Way San Diego, CA 92120
Allied Gardens NeighborhoodEstimated Value: $1,014,439 - $1,173,000
3
Beds
2
Baths
1,620
Sq Ft
$683/Sq Ft
Est. Value
About This Home
This home is located at 5555 Laramie Way, San Diego, CA 92120 and is currently estimated at $1,107,110, approximately $683 per square foot. 5555 Laramie Way is a home located in San Diego County with nearby schools including Marvin Elementary School, Lewis Middle School, and Patrick Henry High School.
Ownership History
Date
Name
Owned For
Owner Type
Purchase Details
Closed on
Jun 24, 1999
Sold by
Riley Delila
Bought by
Riley Michael Scott and Riley Jonathan Gary Carter
Current Estimated Value
Purchase Details
Closed on
Apr 8, 1999
Sold by
Riley Delila L
Bought by
Riley Michael Scott and Riley Jonathan Gary Carter
Purchase Details
Closed on
Jul 19, 1996
Sold by
Riley Delila L
Bought by
Riley Delila L
Create a Home Valuation Report for This Property
The Home Valuation Report is an in-depth analysis detailing your home's value as well as a comparison with similar homes in the area
Home Values in the Area
Average Home Value in this Area
Purchase History
| Date | Buyer | Sale Price | Title Company |
|---|---|---|---|
| Riley Michael Scott | -- | -- | |
| Riley Michael Scott | -- | -- | |
| Riley Delila L | -- | -- |
Source: Public Records
Tax History Compared to Growth
Tax History
| Year | Tax Paid | Tax Assessment Tax Assessment Total Assessment is a certain percentage of the fair market value that is determined by local assessors to be the total taxable value of land and additions on the property. | Land | Improvement |
|---|---|---|---|---|
| 2025 | $1,156 | $100,212 | $27,149 | $73,063 |
| 2024 | $1,156 | $98,248 | $26,617 | $71,631 |
| 2023 | $1,128 | $96,323 | $26,096 | $70,227 |
| 2022 | $1,096 | $94,435 | $25,585 | $68,850 |
| 2021 | $1,087 | $92,584 | $25,084 | $67,500 |
| 2020 | $1,074 | $91,635 | $24,827 | $66,808 |
| 2019 | $1,053 | $89,840 | $24,341 | $65,499 |
| 2018 | $985 | $88,079 | $23,864 | $64,215 |
| 2017 | $960 | $86,353 | $23,397 | $62,956 |
| 2016 | $941 | $84,661 | $22,939 | $61,722 |
| 2015 | $927 | $83,390 | $22,595 | $60,795 |
| 2014 | $912 | $81,758 | $22,153 | $59,605 |
Source: Public Records
Map
Nearby Homes
- 5449 Chaparajos Ct
- 5564 Fontaine St
- 7476 Mission Gorge Rd Unit 219
- 7653 Mission Gorge Rd Unit 50
- 7760 Margerum Ave Unit 124
- 7740 Margerum Ave Unit 204
- 7760 Margerum Ave Unit 126
- 5468 Princess View Place
- 5586 Hamill Ave
- 5253 Lewison Place
- 7737 Margerum Ave Unit 205
- 7137 Keighley St
- 3631 Mission Mesa Way
- 7391 Margerum Ave
- 5125 Fontaine St Unit 105
- 5956 Crow Ct
- 11524 Azucena Dr
- 7310 Margerum Ave
- 11666 Papagallo Ct
- 6817 Birchwood St
- 5545 Laramie Way
- 5565 Laramie Way
- 5535 Laramie Way
- 5575 Laramie Way
- 5552 Red River Dr
- 5546 Red River Dr
- 5558 Laramie Way
- 5558 Red River Dr
- 5538 Red River Dr
- 5525 Laramie Way
- 5568 Laramie Way
- 7602 Lone Star St
- 5585 Laramie Way
- 5534 Red River Dr
- 5578 Laramie Way
- 5566 Red River Dr
- 5515 Laramie Way
- 7610 Lone Star St
- 5528 Red River Dr
- 5601 Laramie Way