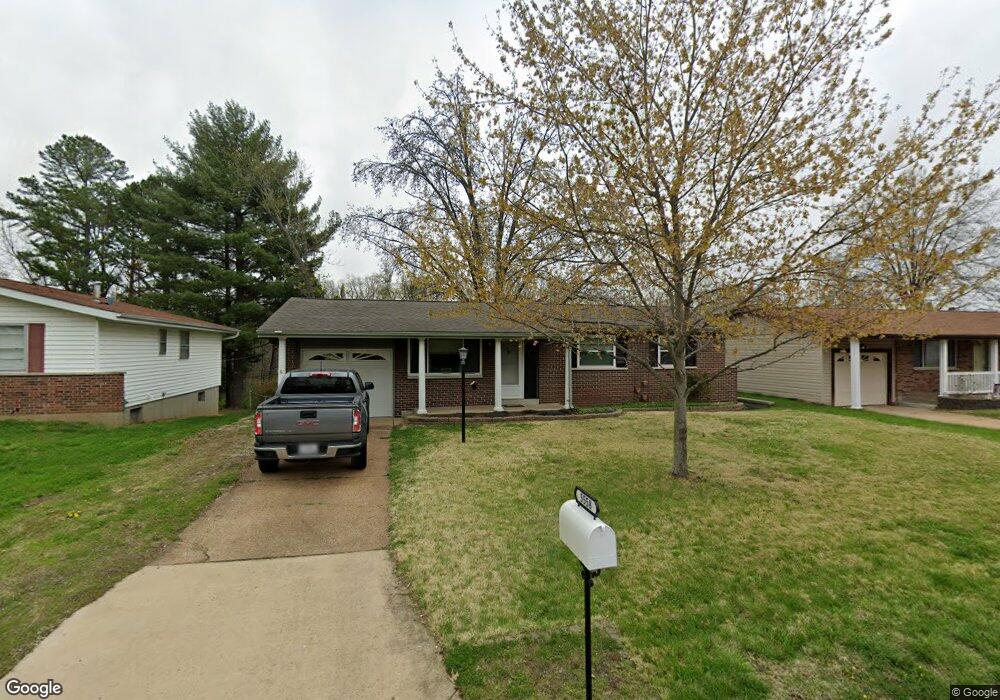
5558 Valleyside Ln Saint Louis, MO 63128
Estimated Value: $214,000 - $286,000
3
Beds
2
Baths
888
Sq Ft
$277/Sq Ft
Est. Value
About This Home
This home is located at 5558 Valleyside Ln, Saint Louis, MO 63128 and is currently estimated at $245,849, approximately $276 per square foot. 5558 Valleyside Ln is a home located in St. Louis County with nearby schools including Hagemann Elementary School, Washington Middle School, and Mehlville High School.
Ownership History
Date
Name
Owned For
Owner Type
Purchase Details
Closed on
Sep 16, 2013
Sold by
Krassinger Daniel A and Krassinger Teresa G
Bought by
Buettner Gregory J
Current Estimated Value
Home Financials for this Owner
Home Financials are based on the most recent Mortgage that was taken out on this home.
Original Mortgage
$128,250
Outstanding Balance
$95,893
Interest Rate
4.45%
Mortgage Type
New Conventional
Estimated Equity
$149,956
Purchase Details
Closed on
Jul 9, 2013
Sold by
Krassinger Daniel A
Bought by
Krassinger Daniel A and Krassinger Teresa G
Purchase Details
Closed on
May 6, 2013
Sold by
Krassinger E Janet C E and Krassinger Janet C
Bought by
Krassinger Daniel A and Krassinger K
Purchase Details
Closed on
Feb 3, 2011
Sold by
Phipps David E
Bought by
Krassinger Janet C
Create a Home Valuation Report for This Property
The Home Valuation Report is an in-depth analysis detailing your home's value as well as a comparison with similar homes in the area
Home Values in the Area
Average Home Value in this Area
Purchase History
| Date | Buyer | Sale Price | Title Company |
|---|---|---|---|
| Buettner Gregory J | $135,000 | Touchstone Title | |
| Krassinger Daniel A | -- | None Available | |
| Krassinger Daniel A | -- | -- | |
| Krassinger Daniel A | -- | -- | |
| Krassinger Janet C | $130,000 | None Available |
Source: Public Records
Mortgage History
| Date | Status | Borrower | Loan Amount |
|---|---|---|---|
| Open | Buettner Gregory J | $128,250 |
Source: Public Records
Tax History Compared to Growth
Tax History
| Year | Tax Paid | Tax Assessment Tax Assessment Total Assessment is a certain percentage of the fair market value that is determined by local assessors to be the total taxable value of land and additions on the property. | Land | Improvement |
|---|---|---|---|---|
| 2025 | $2,458 | $41,180 | $14,710 | $26,470 |
| 2024 | $2,458 | $36,440 | $11,420 | $25,020 |
| 2023 | $2,426 | $36,440 | $11,420 | $25,020 |
| 2022 | $1,957 | $29,470 | $11,420 | $18,050 |
| 2021 | $1,894 | $29,470 | $11,420 | $18,050 |
| 2020 | $1,926 | $28,500 | $9,800 | $18,700 |
| 2019 | $1,920 | $28,500 | $9,800 | $18,700 |
| 2018 | $1,911 | $25,610 | $8,190 | $17,420 |
| 2017 | $1,908 | $25,610 | $8,190 | $17,420 |
| 2016 | $2,060 | $26,560 | $8,190 | $18,370 |
| 2015 | $1,892 | $26,560 | $8,190 | $18,370 |
| 2014 | $1,941 | $26,990 | $5,800 | $21,190 |
Source: Public Records
Map
Nearby Homes
- 4523 Beaver Brook Ct
- 4330 Canyonside Ln
- 5417 Morningdale Place
- 4357 Bristol View Ct
- 5703 Lilac Trails Dr
- 4423 Saddleridge Farm Dr
- 5251 Tuscan Chase Ct
- 4706 Mcilroy Dr
- 5942 Hawkins Fuchs Rd
- 5600 Wickershire Ln
- 4540 Butler Hill Rd
- 5812 Chrisbrook Dr
- 5524 Providence Place Dr
- 5968 Southcrest Way
- 4508 Frederickton Ct
- 5626 Greenton Way
- 4305 Grand Marnier Dr
- 4711 Arevalo Dr
- 4251 Green Grove Ct
- 5896 Rockland Ln
- 5552 Valleyside Ln
- 5564 Valleyside Ln
- 5546 Valleyside Ln
- 5570 Valleyside Ln
- 5540 Valleyside Ln
- 5555 Valleyside Ln
- 5561 Valleyside Ln
- 5549 Valleyside Ln
- 5567 Valleyside Ln
- 5466 Crestside Ln
- 5543 Valleyside Ln
- 5578 Valleyside Ln
- 5534 Valleyside Ln
- 5573 Valleyside Ln
- 5460 Crestside Ln
- 5537 Valleyside Ln
- 4347 Ironside Ln
- 4355 Ironside Ln
- 4339 Ironside Ln
- 5454 Crestside Ln