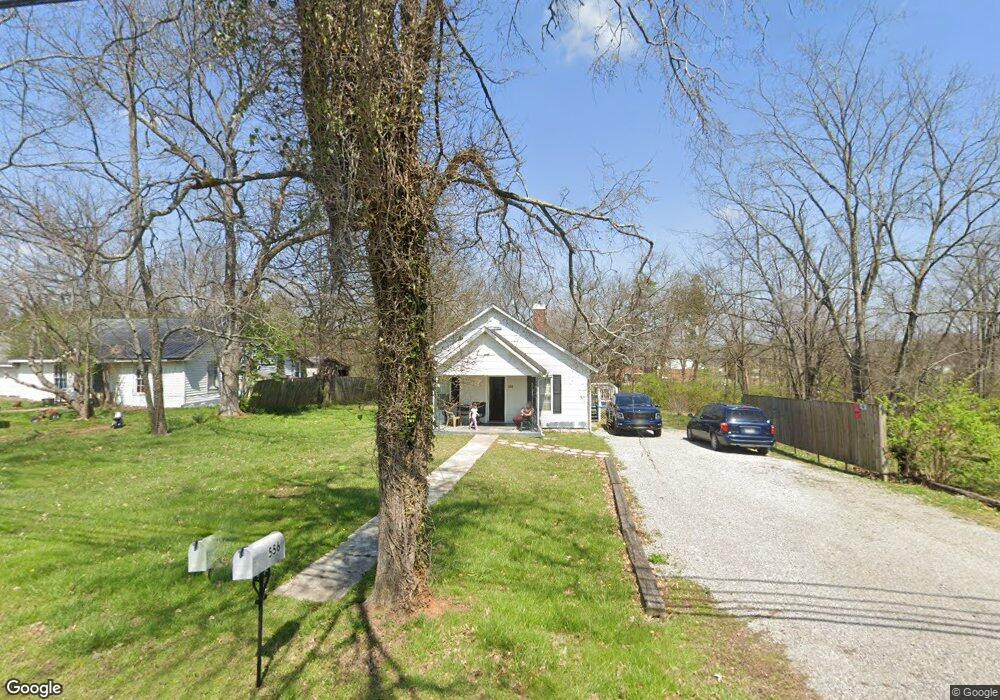
556 Belfast St Lewisburg, TN 37091
Estimated Value: $145,000 - $220,000
--
Bed
2
Baths
1,400
Sq Ft
$136/Sq Ft
Est. Value
About This Home
This home is located at 556 Belfast St, Lewisburg, TN 37091 and is currently estimated at $190,340, approximately $135 per square foot. 556 Belfast St is a home located in Marshall County with nearby schools including Marshall Elementary School, Oak Grove Elementary School, and Westhills Elementary School.
Ownership History
Date
Name
Owned For
Owner Type
Purchase Details
Closed on
Sep 4, 2009
Sold by
Finley Gary
Bought by
Mojica Joaquin O
Current Estimated Value
Home Financials for this Owner
Home Financials are based on the most recent Mortgage that was taken out on this home.
Original Mortgage
$63,775
Outstanding Balance
$41,624
Interest Rate
5.15%
Estimated Equity
$148,716
Purchase Details
Closed on
Aug 14, 2008
Sold by
Frances Davis Mary
Bought by
Gary Finley
Purchase Details
Closed on
Jun 24, 1994
Sold by
Wesley Stafford
Bought by
Frances Davis Mary
Purchase Details
Closed on
Oct 24, 1992
Bought by
Stafford Wesley and Stafford Darlene
Purchase Details
Closed on
Jun 1, 1988
Bought by
King Charles
Purchase Details
Closed on
May 11, 1985
Bought by
Johnson Kathy
Create a Home Valuation Report for This Property
The Home Valuation Report is an in-depth analysis detailing your home's value as well as a comparison with similar homes in the area
Home Values in the Area
Average Home Value in this Area
Purchase History
| Date | Buyer | Sale Price | Title Company |
|---|---|---|---|
| Mojica Joaquin O | $62,500 | -- | |
| Gary Finley | $32,500 | -- | |
| Frances Davis Mary | -- | -- | |
| Stafford Wesley | $21,500 | -- | |
| King Charles | $19,500 | -- | |
| Johnson Kathy | $18,500 | -- |
Source: Public Records
Mortgage History
| Date | Status | Borrower | Loan Amount |
|---|---|---|---|
| Open | Johnson Kathy | $63,775 |
Source: Public Records
Tax History Compared to Growth
Tax History
| Year | Tax Paid | Tax Assessment Tax Assessment Total Assessment is a certain percentage of the fair market value that is determined by local assessors to be the total taxable value of land and additions on the property. | Land | Improvement |
|---|---|---|---|---|
| 2024 | -- | $23,600 | $5,000 | $18,600 |
| 2023 | $732 | $23,600 | $5,000 | $18,600 |
| 2022 | $732 | $23,600 | $5,000 | $18,600 |
| 2021 | $617 | $13,250 | $2,500 | $10,750 |
| 2020 | $617 | $13,250 | $2,500 | $10,750 |
| 2019 | $597 | $13,250 | $2,500 | $10,750 |
| 2018 | $590 | $13,250 | $2,500 | $10,750 |
| 2017 | $590 | $13,250 | $2,500 | $10,750 |
| 2016 | $633 | $12,375 | $2,500 | $9,875 |
| 2015 | $578 | $12,375 | $2,500 | $9,875 |
| 2014 | $578 | $12,375 | $2,500 | $9,875 |
Source: Public Records
Map
Nearby Homes