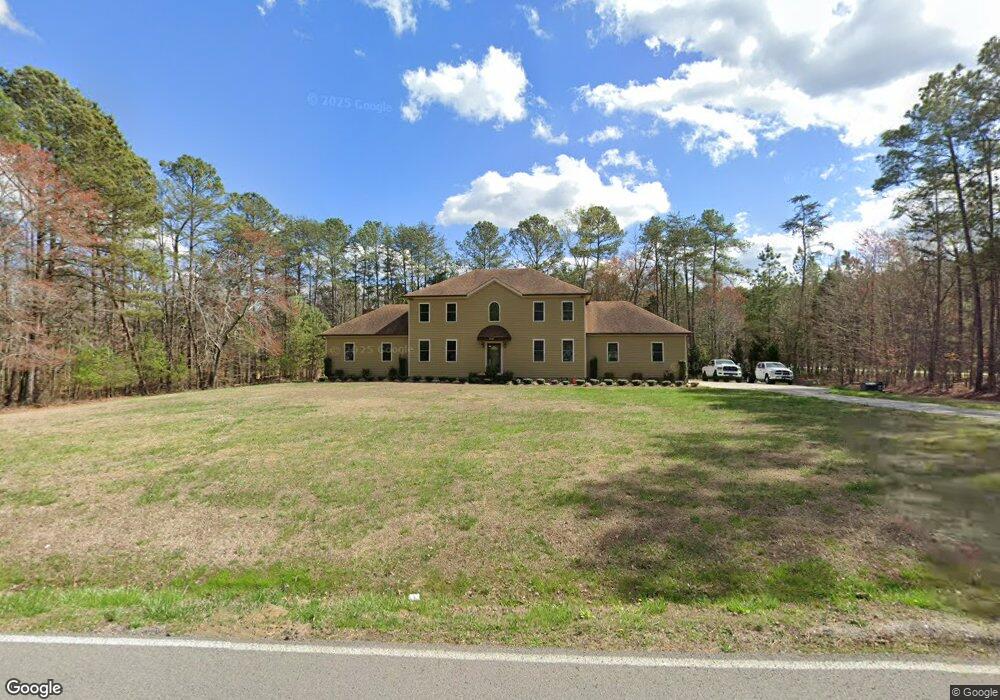
556 Center Grove Rd La Fayette, GA 30728
Noble NeighborhoodEstimated Value: $313,000 - $470,000
4
Beds
3
Baths
3,177
Sq Ft
$118/Sq Ft
Est. Value
About This Home
This home is located at 556 Center Grove Rd, La Fayette, GA 30728 and is currently estimated at $375,724, approximately $118 per square foot. 556 Center Grove Rd is a home located in Walker County with nearby schools including Rock Spring Elementary School, Lafayette High School, and Alice M Daley Adventist School.
Ownership History
Date
Name
Owned For
Owner Type
Purchase Details
Closed on
Mar 23, 2015
Sold by
Keith Telisha R
Bought by
Keith Steven S
Current Estimated Value
Purchase Details
Closed on
Sep 20, 2005
Sold by
Not Provided
Bought by
Keith Steven S and Keith Telisha R
Home Financials for this Owner
Home Financials are based on the most recent Mortgage that was taken out on this home.
Original Mortgage
$143,920
Interest Rate
5.72%
Mortgage Type
New Conventional
Purchase Details
Closed on
Feb 14, 1997
Sold by
Smith Richard and Smith Cynthia
Bought by
Smith Cynthia
Purchase Details
Closed on
Jul 5, 1988
Sold by
Sidney Porter and Sidney Fannie
Bought by
Smith Richard and Smith Cynthia
Purchase Details
Closed on
Jan 1, 1972
Bought by
Sidney Porter and Sidney Fannie
Create a Home Valuation Report for This Property
The Home Valuation Report is an in-depth analysis detailing your home's value as well as a comparison with similar homes in the area
Home Values in the Area
Average Home Value in this Area
Purchase History
| Date | Buyer | Sale Price | Title Company |
|---|---|---|---|
| Keith Steven S | -- | -- | |
| Keith Steven S | $179,900 | -- | |
| Smith Cynthia | $25,000 | -- | |
| Smith Richard | $9,000 | -- | |
| Sidney Porter | -- | -- |
Source: Public Records
Mortgage History
| Date | Status | Borrower | Loan Amount |
|---|---|---|---|
| Previous Owner | Keith Steven S | $143,920 | |
| Previous Owner | Keith Steven S | $35,980 |
Source: Public Records
Tax History Compared to Growth
Tax History
| Year | Tax Paid | Tax Assessment Tax Assessment Total Assessment is a certain percentage of the fair market value that is determined by local assessors to be the total taxable value of land and additions on the property. | Land | Improvement |
|---|---|---|---|---|
| 2024 | $2,889 | $123,709 | $10,033 | $113,676 |
| 2023 | $2,772 | $115,663 | $7,962 | $107,701 |
| 2022 | $2,558 | $100,787 | $6,702 | $94,085 |
| 2021 | $2,594 | $92,651 | $6,702 | $85,949 |
| 2020 | $2,148 | $72,635 | $6,702 | $65,933 |
| 2019 | $2,186 | $72,635 | $6,702 | $65,933 |
| 2018 | $1,922 | $72,635 | $6,702 | $65,933 |
| 2017 | $2,386 | $72,635 | $6,702 | $65,933 |
| 2016 | $1,858 | $72,635 | $6,702 | $65,933 |
| 2015 | $1,761 | $64,601 | $7,056 | $57,545 |
| 2014 | $1,644 | $64,601 | $7,056 | $57,545 |
| 2013 | -- | $64,601 | $7,056 | $57,545 |
Source: Public Records
Map
Nearby Homes
- 0 Veeler Rd Unit 1522679
- 0 Veeler Rd Unit 10628696
- 4654 Us Highway 27
- 4582 Highway N 27
- 23 Willow Cir
- 4544 N Highway 27
- 16 Willow Cir
- 11 Willow Cir
- 329 Lynn Trail
- The Pearson Plan at Laurel Ridge
- The Benson II Plan at Laurel Ridge
- The Langford Plan at Laurel Ridge
- The Lawson Plan at Laurel Ridge
- The Piedmont Plan at Laurel Ridge
- The Coleman Plan at Laurel Ridge
- The McGinnis Plan at Laurel Ridge
- The Caldwell Plan at Laurel Ridge
- 15 Willow Cir
- 1186 E Reed Rd
- 599 Center Grove Rd
- 657 Center Grove Rd
- 464 Center Grove Rd
- 549 Center Grove Rd
- 601 Center Grove Rd
- 457 Center Grove Rd
- 519 Center Grove Rd
- 432 Center Grove Rd
- 680 Center Grove Rd
- 766 Center Grove Rd
- 709 Center Grove Rd
- 373 Center Grove Rd
- 223 Louis Gaither Dr
- 173 Groce Rd
- 783 Center Grove Rd
- 332 Center Grove Rd
- 000 Louis Gaither Dr
- 801 Center Grove Rd
- 744 Center Grove Rd
- 765 Center Grove Rd