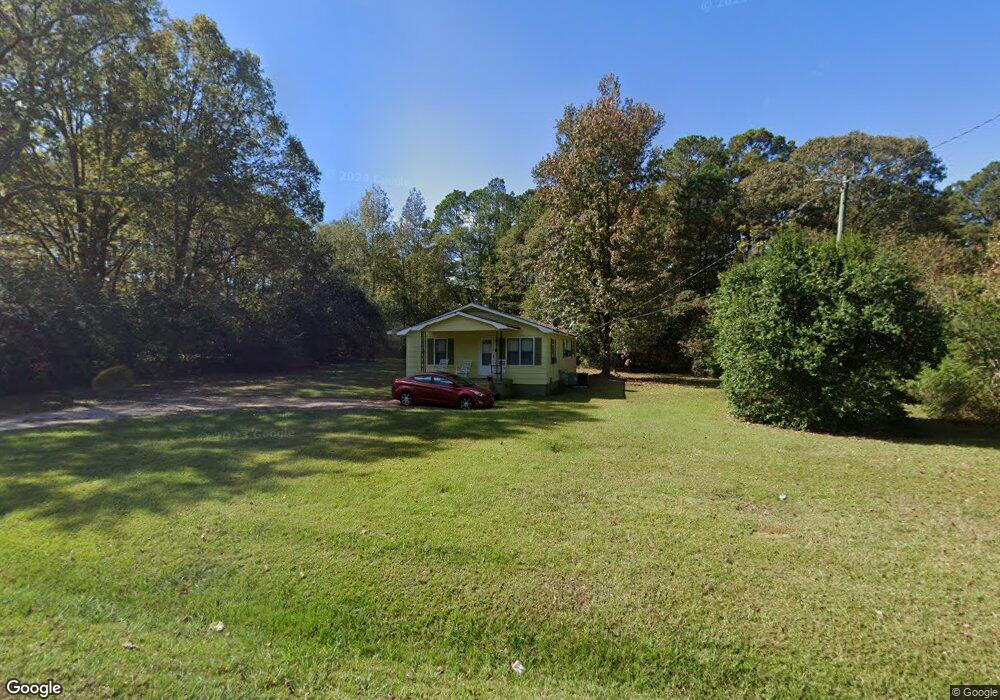
556 Fling Rd Lagrange, GA 30240
Estimated Value: $122,818 - $150,000
2
Beds
1
Bath
1,040
Sq Ft
$130/Sq Ft
Est. Value
About This Home
This home is located at 556 Fling Rd, Lagrange, GA 30240 and is currently estimated at $135,205, approximately $130 per square foot. 556 Fling Rd is a home located in Troup County with nearby schools including Berta Weathersbee Elementary School, Long Cane Elementary School, and Whitesville Road Elementary School.
Ownership History
Date
Name
Owned For
Owner Type
Purchase Details
Closed on
Apr 24, 2008
Sold by
Strickland Tom
Bought by
Tucker Chandra T
Current Estimated Value
Home Financials for this Owner
Home Financials are based on the most recent Mortgage that was taken out on this home.
Original Mortgage
$64,936
Outstanding Balance
$40,811
Interest Rate
5.82%
Mortgage Type
FHA
Estimated Equity
$94,394
Purchase Details
Closed on
Aug 11, 2005
Sold by
Bissett James D
Bought by
Strickland Tom
Purchase Details
Closed on
Apr 3, 1997
Sold by
Annie Ruth Bissett
Bought by
James D Bissett Etal
Purchase Details
Closed on
Aug 18, 1995
Sold by
William B Bisdsett By Ex
Bought by
Annie Ruth Bissett
Purchase Details
Closed on
Jan 1, 1969
Sold by
Mary Dennis and Mary Jo Smith
Bought by
William B Bisdsett By Ex
Purchase Details
Closed on
Jan 1, 1968
Bought by
Mary Dennis and Mary Jo Smith
Create a Home Valuation Report for This Property
The Home Valuation Report is an in-depth analysis detailing your home's value as well as a comparison with similar homes in the area
Home Values in the Area
Average Home Value in this Area
Purchase History
| Date | Buyer | Sale Price | Title Company |
|---|---|---|---|
| Tucker Chandra T | $65,450 | -- | |
| Strickland Tom | $82,000 | -- | |
| James D Bissett Etal | -- | -- | |
| Annie Ruth Bissett | -- | -- | |
| William B Bisdsett By Ex | -- | -- | |
| Mary Dennis | $3,200 | -- |
Source: Public Records
Mortgage History
| Date | Status | Borrower | Loan Amount |
|---|---|---|---|
| Open | Tucker Chandra T | $64,936 |
Source: Public Records
Tax History Compared to Growth
Tax History
| Year | Tax Paid | Tax Assessment Tax Assessment Total Assessment is a certain percentage of the fair market value that is determined by local assessors to be the total taxable value of land and additions on the property. | Land | Improvement |
|---|---|---|---|---|
| 2024 | $724 | $26,560 | $10,000 | $16,560 |
| 2023 | $697 | $25,560 | $8,000 | $17,560 |
| 2022 | $685 | $24,560 | $8,000 | $16,560 |
| 2021 | $690 | $22,880 | $8,000 | $14,880 |
| 2020 | $690 | $22,880 | $8,000 | $14,880 |
| 2019 | $567 | $18,808 | $5,328 | $13,480 |
| 2018 | $530 | $17,568 | $5,328 | $12,240 |
| 2017 | $530 | $17,568 | $5,328 | $12,240 |
| 2016 | $518 | $17,178 | $5,328 | $11,850 |
| 2015 | $519 | $17,178 | $5,328 | $11,850 |
| 2014 | $501 | $16,555 | $5,328 | $11,227 |
| 2013 | -- | $17,580 | $5,328 | $12,252 |
Source: Public Records
Map
Nearby Homes
- 37 Overbrook Dr
- 808 S Fling Rd
- 509 Connie Dr
- 0 Bradfield Dr Unit 10568803
- 190 Hill Rd
- 110 Hawthorne Cir
- 103 Hawthorne Cir
- 124 Foxdale Dr
- 105 Hawthorne Cir
- 61 Freeman Rd
- 22 Freeman Rd
- 141 Avery Dr
- 146 Whitaker Rd
- 100 Huntcliff Ct
- 0 Unit 10514554
- 135 Planters Ridge Dr
- 223 Pinehaven Dr
- 117 Brookwood Dr
- LOT 4 Angela Dr
- 141 Plymouth Dr
- 570 Fling Rd
- 538 Fling Rd
- 551 Fling Rd
- 26 Center Rd
- 567 Fling Rd Unit B
- 567 Fling Rd
- 567 Fling Rd Unit B
- 38 Center Rd
- 520 Fling Rd
- 2842 W Point Rd
- 2898 W Point Rd
- 82 Center Rd
- 790 S Fling Rd
- 90 Center Rd
- 29 Center Rd
- 2922 West Point Rd
- 2877 West Point Rd
- 73 Center Rd
- 0 Center Rd Unit 7497188
- 0 Center Rd Unit 8252934