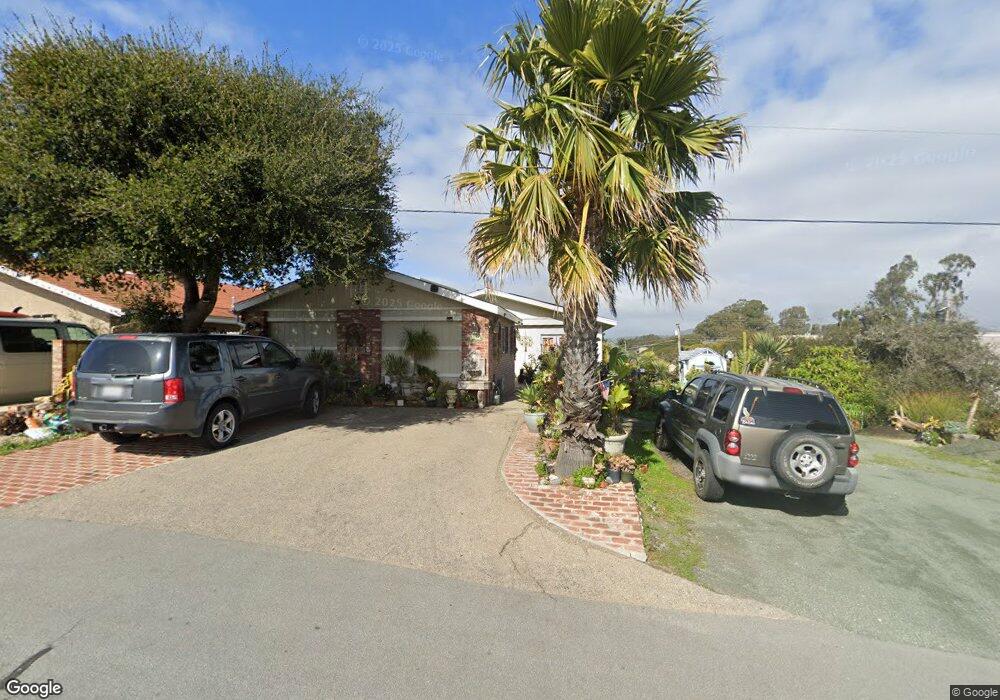
556 Skyline Dr Los Osos, CA 93402
Estimated Value: $712,000 - $840,000
3
Beds
1
Bath
1,167
Sq Ft
$658/Sq Ft
Est. Value
About This Home
This home is located at 556 Skyline Dr, Los Osos, CA 93402 and is currently estimated at $768,187, approximately $658 per square foot. 556 Skyline Dr is a home located in San Luis Obispo County with nearby schools including Monarch Grove Elementary School, Los Osos Middle School, and Morro Bay High School.
Ownership History
Date
Name
Owned For
Owner Type
Purchase Details
Closed on
Jun 12, 2003
Sold by
Lee Miriam
Bought by
Lee Robert E and Lee Miriam F
Current Estimated Value
Home Financials for this Owner
Home Financials are based on the most recent Mortgage that was taken out on this home.
Original Mortgage
$300,800
Outstanding Balance
$127,838
Interest Rate
5.37%
Mortgage Type
Purchase Money Mortgage
Estimated Equity
$640,349
Purchase Details
Closed on
Mar 14, 2002
Sold by
Lee Robert E
Bought by
Lee Miriam
Home Financials for this Owner
Home Financials are based on the most recent Mortgage that was taken out on this home.
Original Mortgage
$39,000
Interest Rate
6.85%
Mortgage Type
Stand Alone Second
Purchase Details
Closed on
Feb 20, 2002
Sold by
Moreno Cayetano and Moreno Gretchen
Bought by
Lee Miriam
Home Financials for this Owner
Home Financials are based on the most recent Mortgage that was taken out on this home.
Original Mortgage
$39,000
Interest Rate
6.85%
Mortgage Type
Stand Alone Second
Create a Home Valuation Report for This Property
The Home Valuation Report is an in-depth analysis detailing your home's value as well as a comparison with similar homes in the area
Home Values in the Area
Average Home Value in this Area
Purchase History
| Date | Buyer | Sale Price | Title Company |
|---|---|---|---|
| Lee Robert E | -- | Chicago Title Company | |
| Lee Miriam | -- | Chicago Title Co | |
| Lee Miriam | $260,000 | Chicago Title Co |
Source: Public Records
Mortgage History
| Date | Status | Borrower | Loan Amount |
|---|---|---|---|
| Open | Lee Robert E | $300,800 | |
| Closed | Lee Miriam | $39,000 | |
| Closed | Lee Miriam | $195,000 |
Source: Public Records
Tax History
| Year | Tax Paid | Tax Assessment Tax Assessment Total Assessment is a certain percentage of the fair market value that is determined by local assessors to be the total taxable value of land and additions on the property. | Land | Improvement |
|---|---|---|---|---|
| 2025 | $7,630 | $384,075 | $199,424 | $184,651 |
| 2024 | $7,862 | $376,545 | $195,514 | $181,031 |
| 2023 | $7,862 | $369,163 | $191,681 | $177,482 |
| 2022 | $7,332 | $361,925 | $187,923 | $174,002 |
| 2021 | $6,986 | $354,830 | $184,239 | $170,591 |
| 2020 | $6,699 | $351,192 | $182,350 | $168,842 |
| 2019 | $6,745 | $344,307 | $178,775 | $165,532 |
| 2018 | $6,537 | $337,557 | $175,270 | $162,287 |
| 2017 | $5,593 | $330,939 | $171,834 | $159,105 |
| 2016 | $4,671 | $324,451 | $168,465 | $155,986 |
| 2015 | $4,617 | $319,578 | $165,935 | $153,643 |
| 2014 | $4,331 | $313,319 | $162,685 | $150,634 |
Source: Public Records
Map
Nearby Homes
- 1840 Pine Ave
- 1830 Pine Ave
- 0 Ash St
- 2045 Pine Ave
- 305 Henrietta Ave
- 1871 Donna Ave
- 633 Ramona Ave Unit 26
- 0 Garden St
- 701 Los Osos Valley Rd
- 1705 5th St
- 749 Woodland Dr
- 781 Los Osos Valley Rd
- 319 Mar Vista Dr
- 306 Highland Dr
- 2021 9th St
- 1701 8th St
- 224 Butte Dr
- 2265 Del Norte St
- 246 Vista Ct
- 1937 11th St
Your Personal Tour Guide
Ask me questions while you tour the home.