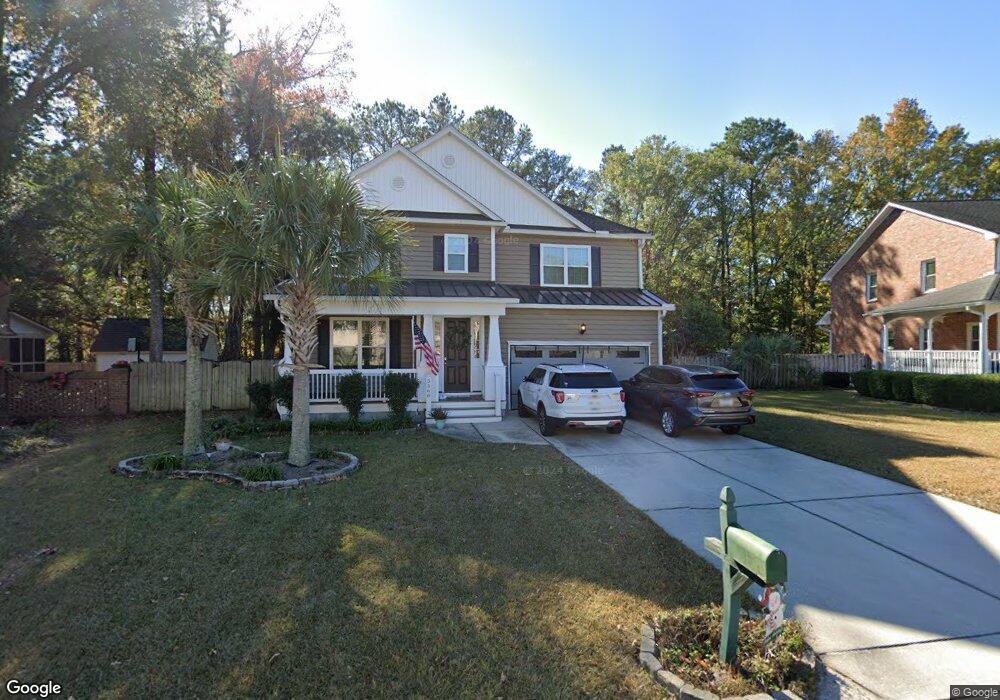
5560 Gallatin Ln North Charleston, SC 29420
Estimated Value: $446,000 - $519,000
3
Beds
3
Baths
2,392
Sq Ft
$203/Sq Ft
Est. Value
About This Home
This home is located at 5560 Gallatin Ln, North Charleston, SC 29420 and is currently estimated at $485,520, approximately $202 per square foot. 5560 Gallatin Ln is a home located in Dorchester County with nearby schools including Eagle Nest Elementary School, River Oaks Middle School, and Fort Dorchester High School.
Ownership History
Date
Name
Owned For
Owner Type
Purchase Details
Closed on
Apr 1, 2015
Sold by
Steele John David
Bought by
Steele Kelly and Turner Kenneth
Current Estimated Value
Home Financials for this Owner
Home Financials are based on the most recent Mortgage that was taken out on this home.
Original Mortgage
$159,200
Outstanding Balance
$58,740
Interest Rate
3.87%
Mortgage Type
New Conventional
Estimated Equity
$426,780
Purchase Details
Closed on
Mar 26, 2015
Sold by
Ben Mccormick Homes Llc
Bought by
Steele John David
Home Financials for this Owner
Home Financials are based on the most recent Mortgage that was taken out on this home.
Original Mortgage
$159,200
Outstanding Balance
$58,740
Interest Rate
3.87%
Mortgage Type
New Conventional
Estimated Equity
$426,780
Purchase Details
Closed on
Sep 15, 2014
Sold by
Chisolm Vermell E and Vermell E Chisolm Living Trust
Bought by
Ben Mccormick Homes Llc
Purchase Details
Closed on
Sep 19, 2008
Sold by
Chisolm Vermell E and Whaley Vermell C
Bought by
Chisolm Vermelle E and Vermell E Chisolm Living Trust
Create a Home Valuation Report for This Property
The Home Valuation Report is an in-depth analysis detailing your home's value as well as a comparison with similar homes in the area
Home Values in the Area
Average Home Value in this Area
Purchase History
| Date | Buyer | Sale Price | Title Company |
|---|---|---|---|
| Steele Kelly | $199,000 | -- | |
| Steele John David | -- | -- | |
| Ben Mccormick Homes Llc | $33,500 | -- | |
| Chisolm Vermelle E | -- | -- |
Source: Public Records
Mortgage History
| Date | Status | Borrower | Loan Amount |
|---|---|---|---|
| Open | Steele Kelly | $159,200 |
Source: Public Records
Tax History Compared to Growth
Tax History
| Year | Tax Paid | Tax Assessment Tax Assessment Total Assessment is a certain percentage of the fair market value that is determined by local assessors to be the total taxable value of land and additions on the property. | Land | Improvement |
|---|---|---|---|---|
| 2024 | $2,654 | $16,361 | $5,000 | $11,361 |
| 2023 | $2,654 | $9,452 | $2,800 | $6,652 |
| 2022 | $2,351 | $9,070 | $2,300 | $6,770 |
| 2021 | $2,351 | $9,070 | $2,300 | $6,770 |
| 2020 | $2,258 | $9,067 | $2,300 | $6,767 |
| 2019 | $2,227 | $9,067 | $2,300 | $6,767 |
| 2018 | $1,971 | $2,000 | $2,000 | $0 |
| 2017 | $1,911 | $2,000 | $2,000 | $0 |
| 2016 | $1,911 | $2,000 | $2,000 | $0 |
| 2015 | $1,257 | $3,000 | $3,000 | $0 |
| 2014 | $971 | $40,250 | $0 | $0 |
| 2013 | -- | $2,420 | $0 | $0 |
Source: Public Records
Map
Nearby Homes
- 8701 Caspiana Ln
- 5488 Altamaha Dr
- 8620 Coppergrove Dr
- 5472 Altamaha Dr
- 8657 Coppergrove Dr
- 8725 Evangeline Dr
- 8740 Silver Perch Ln
- 8608 Hickory Creek Ln
- 8728 Silver Creek Ln
- 5523 Sageborough Dr
- 8723 Silver Perch Ln
- 8721 Silver Perch Ln
- 8719 Silver Perch Ln
- 8717 Silver Perch Ln
- 8715 Silver Perch Ln
- 8713 Silver Perch Ln
- 8525 Long Meadow Dr
- 8709 Silver Perch Ln
- 8707 Silver Perch Ln
- 8705 Silver Perch Ln
- 5556 Gallatin Ln
- 5564 Gallatin Ln
- 5561 Gallatin Ln
- 5552 Gallatin Ln
- 5555 Gallatin Ln
- 8700 Woodfin Dr
- 5567 Gallatin Ln
- 5548 Gallatin Ln
- 5549 Gallatin Ln
- 5508 Layton Ct
- 5512 Layton Ct
- 0 Caspiana Ln
- 5572 Gallatin Ln
- 8709 Caspiana Ln
- 5501 Cainwood Rd
- 5543 Gallatin Ln
- 5544 Gallatin Ln
- 5504 Layton Ct
- 5406 Berkers Ct W
- 5573 Gallatin Ln