5560 Halsted Way Unit 6 Lithonia, GA 30038
Lithonia NeighborhoodEstimated Value: $222,000 - $236,000
3
Beds
2
Baths
1,449
Sq Ft
$159/Sq Ft
Est. Value
About This Home
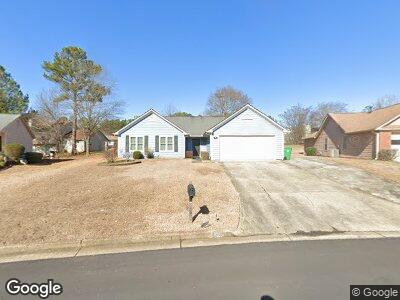
This home is located at 5560 Halsted Way Unit 6, Lithonia, GA 30038 and is currently estimated at $230,921, approximately $159 per square foot. 5560 Halsted Way Unit 6 is a home located in DeKalb County with nearby schools including Flat Rock Elementary School, Salem Middle School, and Martin Luther King- Jr. High School.
Ownership History
Date
Name
Owned For
Owner Type
Purchase Details
Closed on
Nov 30, 2006
Sold by
Federal Natl Mtg Assn Fnma
Bought by
Tyes Charles
Current Estimated Value
Home Financials for this Owner
Home Financials are based on the most recent Mortgage that was taken out on this home.
Original Mortgage
$24,000
Interest Rate
6.29%
Mortgage Type
Stand Alone Refi Refinance Of Original Loan
Purchase Details
Closed on
May 2, 2006
Sold by
Netbank
Bought by
Federal Natl Mtg Assn Fnma
Purchase Details
Closed on
Mar 31, 2003
Sold by
Mccloud Pat
Bought by
Ashe-Wright Angalique
Home Financials for this Owner
Home Financials are based on the most recent Mortgage that was taken out on this home.
Original Mortgage
$111,200
Interest Rate
5.74%
Mortgage Type
New Conventional
Purchase Details
Closed on
Feb 28, 1997
Sold by
White Monroe Mary
Bought by
Edokun Pat
Create a Home Valuation Report for This Property
The Home Valuation Report is an in-depth analysis detailing your home's value as well as a comparison with similar homes in the area
Home Values in the Area
Average Home Value in this Area
Purchase History
| Date | Buyer | Sale Price | Title Company |
|---|---|---|---|
| Tyes Charles | -- | -- | |
| Federal Natl Mtg Assn Fnma | -- | -- | |
| Netbank | $98,363 | -- | |
| Ashe-Wright Angalique | $111,200 | -- | |
| Edokun Pat | $86,500 | -- |
Source: Public Records
Mortgage History
| Date | Status | Borrower | Loan Amount |
|---|---|---|---|
| Closed | Tyes Charles | $24,000 | |
| Previous Owner | Ashe-Wright Angalique | $111,200 | |
| Previous Owner | Mccloud Pat | $89,305 | |
| Closed | Edokun Pat | $0 |
Source: Public Records
Tax History Compared to Growth
Tax History
| Year | Tax Paid | Tax Assessment Tax Assessment Total Assessment is a certain percentage of the fair market value that is determined by local assessors to be the total taxable value of land and additions on the property. | Land | Improvement |
|---|---|---|---|---|
| 2023 | $2,685 | $89,400 | $16,000 | $73,400 |
| 2022 | $2,196 | $76,000 | $4,800 | $71,200 |
| 2021 | $1,750 | $55,680 | $4,800 | $50,880 |
| 2020 | $1,452 | $45,480 | $4,800 | $40,680 |
| 2019 | $1,398 | $43,320 | $4,800 | $38,520 |
| 2018 | $1,079 | $39,880 | $4,800 | $35,080 |
| 2017 | $1,027 | $31,560 | $3,360 | $28,200 |
| 2016 | $1,011 | $31,800 | $3,360 | $28,440 |
| 2014 | $856 | $27,200 | $3,360 | $23,840 |
Source: Public Records
Map
Nearby Homes
- 5550 Mccrossin Cir
- 3251 Hunters Crossing Point
- 5632 Rock Springs Rd
- 3267 Forette Ln
- 3099 Regency Park Dr
- 3248 Brisbane Way
- 5600 Rock Springs Rd
- 5566 La Fleur Trail
- 3100 Aberdeen Way
- 3037 Bonnes Dr
- 5379 Winslow Crossing
- 5599 Fair Creek Way
- 3284 Pennington Dr
- 5574 Fair Creek Way
- 3332 Fannin Ct
- 5640 Bradley Cir
- 5338 Timor Trail
- 5560 Halsted Way Unit 6
- 5556 Halsted Way
- 5553 Mccrossin Cir
- 5559 Mccrossin Cir
- 5549 Mccrossin Cir Unit 6
- 5565 Mccrossin Cir
- 3211 Pearce Ct
- 5552 Halsted Way
- 3205 Pearce Ct
- 5565 Halsted Way
- 5557 Halsted Way
- 3223 Pearce Ct
- 3199 Pearce Ct
- 0 Pearce Ct Unit 8715295
- 0 Pearce Ct Unit 7194770
- 0 Pearce Ct Unit 3217168
- 0 Pearce Ct Unit 3195042
- 0 Pearce Ct Unit 3150740
- 0 Pearce Ct Unit 8838844
- 0 Pearce Ct Unit 8758498