5566 Killarney St Denver, CO 80249
Green Valley Ranch NeighborhoodEstimated Value: $460,000 - $495,000
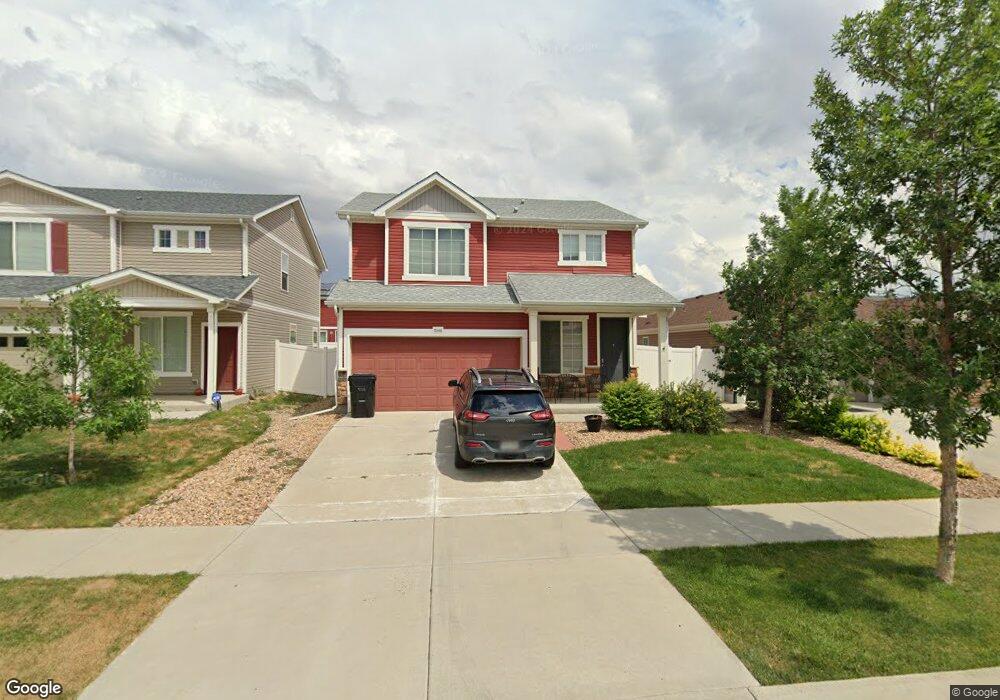
About This Home
This home is located at 5566 Killarney St, Denver, CO 80249 and is currently estimated at $471,821, approximately $270 per square foot. 5566 Killarney St is a home located in Denver County with nearby schools including Pitt-Waller K-8 School, McGlone Academy, and Marie L. Greenwood Academy.
Ownership History
We collect this data history from publicly available records. To have your information removed, we recommend requesting removal directly through your county’s website.
Purchase Details
Home Financials for this Owner
Home Financials are based on the most recent Mortgage that was taken out on this home.Purchase Details
Home Financials for this Owner
Home Financials are based on the most recent Mortgage that was taken out on this home.Purchase Details
Home Financials for this Owner
Home Financials are based on the most recent Mortgage that was taken out on this home.Home Values in the Area
Average Home Value in this Area
Purchase History
We collect this data history from publicly available records. To have your information removed, we recommend requesting removal directly through your county’s website.
| Date | Buyer | Sale Price | Title Company |
|---|---|---|---|
| $295,300 | First American Title Ins Co | ||
| $210,000 | Fita | ||
| $183,500 | Town & Country Title Service |
Mortgage History
We collect this data history from publicly available records. To have your information removed, we recommend requesting removal directly through your county’s website.
| Date | Status | Borrower | Loan Amount |
|---|---|---|---|
| Open | $289,950 | ||
| Previous Owner | $214,515 | ||
| Previous Owner | $181,104 |
Tax History
We collect this data history from publicly available records. To have your information removed, we recommend requesting removal directly through your county’s website.
| Year | Tax Paid | Tax Assessment Tax Assessment Total Assessment is a certain percentage of the fair market value that is determined by local assessors to be the total taxable value of land and additions on the property. | Land | Improvement |
|---|---|---|---|---|
| 2025 | $4,077 | $33,790 | $4,530 | $4,530 |
| 2024 | $3,875 | $30,290 | $620 | $29,670 |
| 2023 | $3,730 | $30,290 | $620 | $29,670 |
| 2022 | $3,311 | $24,870 | $3,860 | $21,010 |
| 2021 | $3,058 | $25,590 | $3,980 | $21,610 |
| 2020 | $3,142 | $23,710 | $3,980 | $19,730 |
| 2019 | $3,093 | $23,710 | $3,980 | $19,730 |
| 2018 | $2,685 | $19,830 | $2,460 | $17,370 |
| 2017 | $3,331 | $19,830 | $2,460 | $17,370 |
| 2016 | $3,039 | $18,360 | $2,380 | $15,980 |
| 2015 | $2,977 | $18,360 | $2,380 | $15,980 |
| 2014 | $2,570 | $16,260 | $2,388 | $13,872 |
Map
- 5571 Killarney St
- 5552 Killarney St
- 20641 Randolph Place
- 5548 Killarney Ct
- 5535 Killarney Ct
- 20691 Randolph Place
- 5561 Lisbon St
- 5553 Jebel Ct
- 20437 E 56th Place
- 20407 E 56th Place
- 5577 Jebel Ct
- 5686 N Killarney Ct
- 5688 N Killarney Ct
- 5683 N Kirk Ct
- 5802 N Perth St
- 5785 N Jericho Way
- 20513 E 57th Ave
- 5545 Iran St
- 5743 N Jebel Way
- 20341 E 57th Ave
- 5561 Killarney St
- 5563 Killarney St
- 5565 Killarney St
- 5567 Killarney St
- 5559 Killarney St
- 5569 Killarney St
- 5557 Killarney St
- 5570 Killarney St
- 5558 Killarney St
- 20546 Robins Dr
- 5556 Killarney St
- 5555 Killarney St
- 5564 Jericho Ct
- 5573 Killarney St
- 5561 Jericho Ct
- 5566 Jericho Ct
- 5565 Killarney Ct
- 20536 Robins Dr
- 5563 Jericho Ct
- 5569 Killarney Ct
Ask me questions while you tour the home.