
Estimated payment $1,768/month
Total Views
3,395
3
Beds
2
Baths
1,122
Sq Ft
$236
Price per Sq Ft
Highlights
- Mountain View
- Open Patio
- Landscaped
- Community Playground
- Tile Flooring
- Forced Air Heating and Cooling System
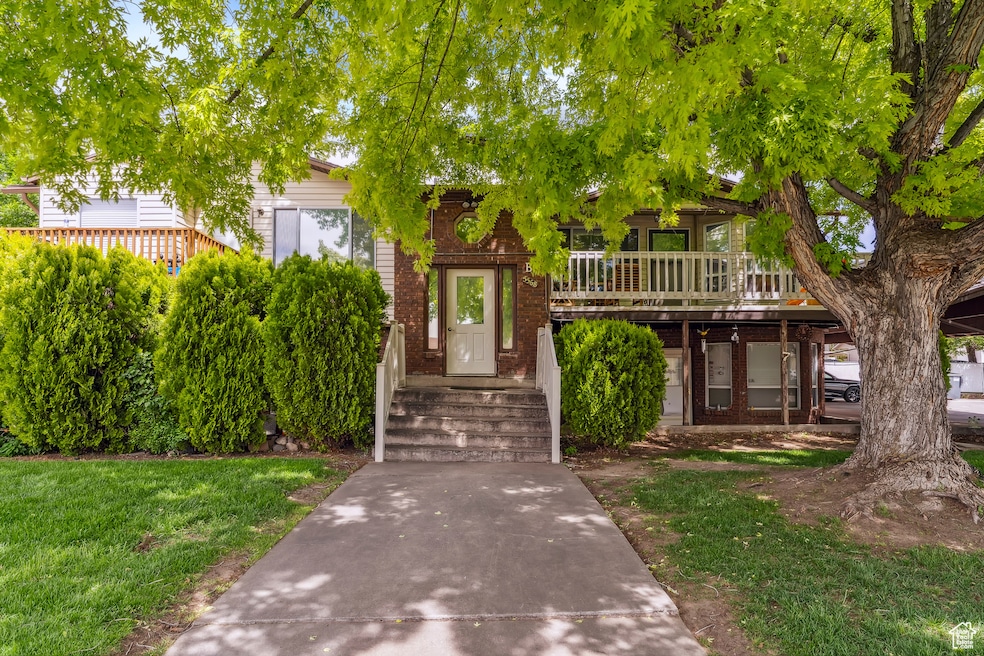
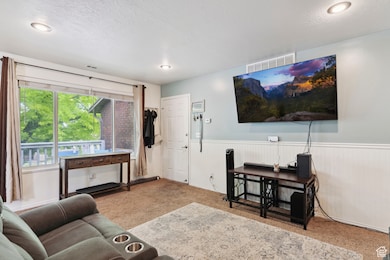
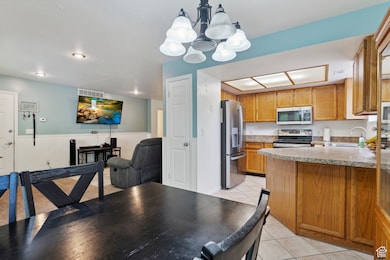
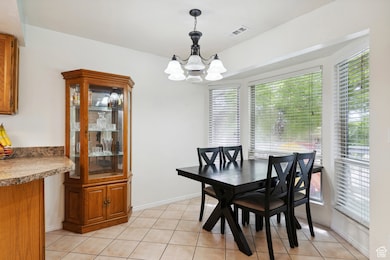
About This Home
Cozy 3-Bed, 2-Bath Condo in the Heart of Roy Welcome to this charming and well-maintained 3-bedroom, 2-bathroom condo located in the heart of Roy. Situated in a convenient location close to shopping, dining, schools, parks, and easy freeway access, this home offers both comfort and accessibility.
Listing Agent
Jerrica Long
Real Broker, LLC License #8430518 Listed on: 05/25/2025
Property Details
Home Type
- Condominium
Est. Annual Taxes
- $1,423
Year Built
- Built in 1985
HOA Fees
- $185 Monthly HOA Fees
Home Design
- Brick Exterior Construction
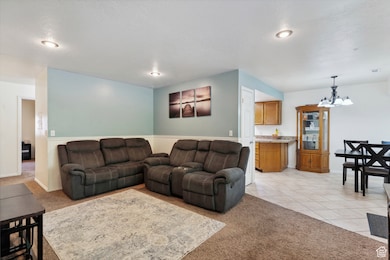
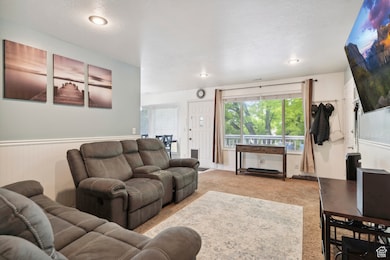
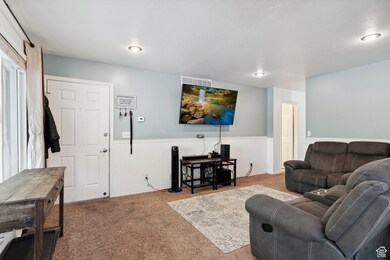
Interior Spaces
- 1,122 Sq Ft Home
- 1-Story Property
- Blinds
- Mountain Views
- Electric Dryer Hookup
Kitchen
- Built-In Range
- Microwave
Flooring
- Carpet
- Tile
- Vinyl
Bedrooms and Bathrooms
- 3 Main Level Bedrooms
Parking
- 2 Parking Spaces
- 1 Carport Space
- Open Parking
Schools
- Roy Elementary And Middle School
- Roy High School
Utilities
- Forced Air Heating and Cooling System
- Natural Gas Connected
- Sewer Paid
Additional Features
- Open Patio
- Landscaped
Listing and Financial Details
- Exclusions: Dryer, Washer
- Assessor Parcel Number 09-245-0005
Community Details
Overview
- Association fees include sewer, trash, water
- Kentwood Condominiums Association, Phone Number (801) 399-5883
- The Kentwood Condomi Subdivision
Recreation
- Community Playground
- Snow Removal
Pet Policy
- Pets Allowed
Map
Create a Home Valuation Report for This Property
The Home Valuation Report is an in-depth analysis detailing your home's value as well as a comparison with similar homes in the area
Home Values in the Area
Average Home Value in this Area
Tax History
| Year | Tax Paid | Tax Assessment Tax Assessment Total Assessment is a certain percentage of the fair market value that is determined by local assessors to be the total taxable value of land and additions on the property. | Land | Improvement |
|---|---|---|---|---|
| 2024 | $1,424 | $139,150 | $33,000 | $106,150 |
| 2023 | $1,349 | $132,000 | $33,000 | $99,000 |
| 2022 | $1,318 | $131,450 | $33,000 | $98,450 |
| 2021 | $1,167 | $193,000 | $18,000 | $175,000 |
| 2020 | $938 | $142,000 | $18,000 | $124,000 |
| 2019 | $895 | $128,000 | $16,000 | $112,000 |
| 2018 | $792 | $107,000 | $16,000 | $91,000 |
| 2017 | $682 | $86,800 | $13,000 | $73,800 |
| 2016 | $653 | $47,300 | $5,500 | $41,800 |
| 2015 | $567 | $40,150 | $5,500 | $34,650 |
| 2014 | $393 | $27,500 | $5,500 | $22,000 |
Source: Public Records
Property History
| Date | Event | Price | Change | Sq Ft Price |
|---|---|---|---|---|
| 07/09/2025 07/09/25 | Price Changed | $265,000 | -1.9% | $236 / Sq Ft |
| 06/20/2025 06/20/25 | Price Changed | $269,999 | 0.0% | $241 / Sq Ft |
| 06/08/2025 06/08/25 | For Sale | $270,000 | 0.0% | $241 / Sq Ft |
| 06/04/2025 06/04/25 | Pending | -- | -- | -- |
| 05/25/2025 05/25/25 | For Sale | $270,000 | -- | $241 / Sq Ft |
Source: UtahRealEstate.com
Purchase History
| Date | Type | Sale Price | Title Company |
|---|---|---|---|
| Warranty Deed | -- | Oasis Title Llc | |
| Interfamily Deed Transfer | -- | Stewart Title Insurance Agcy | |
| Warranty Deed | -- | American Dream Title Ins Age |
Source: Public Records
Mortgage History
| Date | Status | Loan Amount | Loan Type |
|---|---|---|---|
| Open | $10,100 | Stand Alone Second | |
| Open | $185,576 | FHA | |
| Previous Owner | $112,433 | FHA | |
| Previous Owner | $88,369 | FHA |
Source: Public Records
Similar Homes in Roy, UT
Source: UtahRealEstate.com
MLS Number: 2087490
APN: 09-245-0005
Disclaimer: Certain information contained herein is derived from information provided by parties other than Homes.com. All information provided is deemed reliable, but is not guaranteed to be accurate and should be independently verified.
![]() IDX information is provided exclusively for consumers’ personal, non-commercial use, that it may not be used for any purpose other than to identify prospective properties consumers may be interested in purchasing, and that the data is deemed reliable but is not guaranteed accurate by the MLS. Licensor is only providing the MLS Content and not other sources of data provided in the Product.
IDX information is provided exclusively for consumers’ personal, non-commercial use, that it may not be used for any purpose other than to identify prospective properties consumers may be interested in purchasing, and that the data is deemed reliable but is not guaranteed accurate by the MLS. Licensor is only providing the MLS Content and not other sources of data provided in the Product.
Based on information from the Wasatch Front Regional Multiple Listing Service, Inc.. All data, including all measurements and calculations of area, is obtained from various sources and has not been, and will not be, verified by broker or the MLS. All information should be independently reviewed and verified for accuracy. Properties may or may not be listed by the office/agent presenting the information.
Nearby Homes