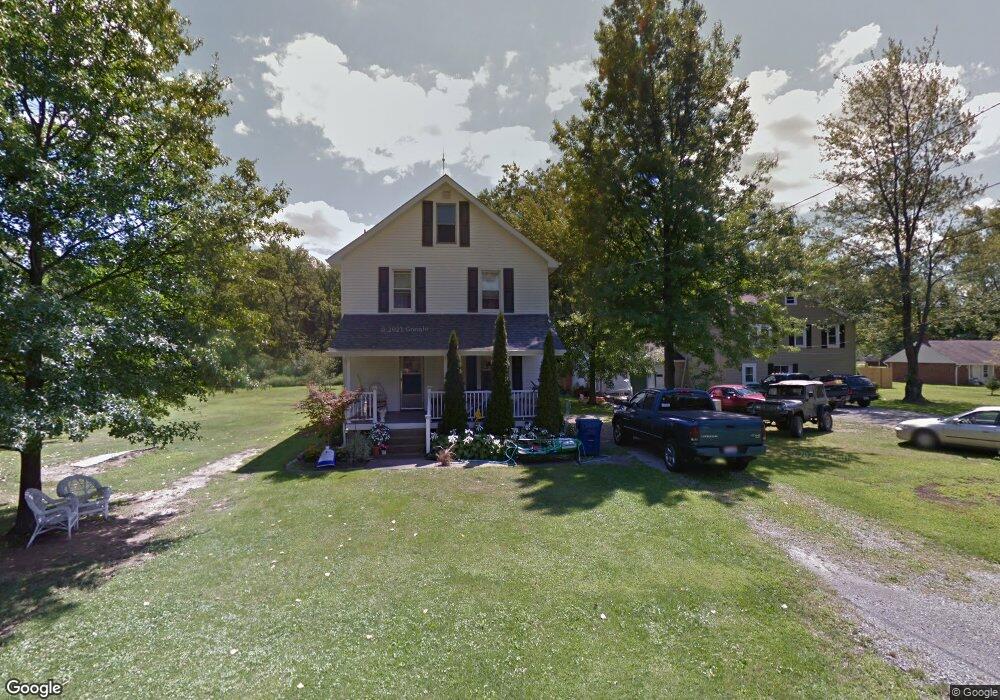
557 Ferncliff Ave Youngstown, OH 44514
Estimated Value: $138,655 - $216,000
3
Beds
1
Bath
1,416
Sq Ft
$128/Sq Ft
Est. Value
About This Home
This home is located at 557 Ferncliff Ave, Youngstown, OH 44514 and is currently estimated at $180,914, approximately $127 per square foot. 557 Ferncliff Ave is a home located in Mahoning County with nearby schools including Stadium Drive Elementary School, Boardman Glenwood Junior High School, and Boardman High School.
Ownership History
Date
Name
Owned For
Owner Type
Purchase Details
Closed on
Dec 9, 2022
Bought by
Moradian Bedros A
Current Estimated Value
Purchase Details
Closed on
Sep 13, 2022
Bought by
Ian Gurd
Purchase Details
Closed on
Mar 15, 2022
Bought by
Gurd Ian
Purchase Details
Closed on
Jul 5, 2005
Sold by
Gurd Charles and Gurd Pamela
Bought by
Gurd Billie
Purchase Details
Closed on
Jun 17, 2005
Sold by
Buckshaw Joy and Buckshaw George
Bought by
Gurd Billie
Purchase Details
Closed on
May 18, 2005
Sold by
Gurd Ian and Gurd Susan
Bought by
Gurd Billie
Purchase Details
Closed on
Sep 23, 2004
Sold by
Estate Of Irma V Gurd
Bought by
Gurd Billie and Buckshaw Joy
Purchase Details
Closed on
Oct 13, 1989
Sold by
Gurd Irma
Bought by
Gurd Irma
Purchase Details
Closed on
Jul 1, 1970
Sold by
Gurd Marshall A
Bought by
Gurd Irma
Purchase Details
Closed on
Jun 29, 1936
Bought by
Billie Gurd
Create a Home Valuation Report for This Property
The Home Valuation Report is an in-depth analysis detailing your home's value as well as a comparison with similar homes in the area
Home Values in the Area
Average Home Value in this Area
Purchase History
| Date | Buyer | Sale Price | Title Company |
|---|---|---|---|
| Moradian Bedros A | $25,000 | -- | |
| Ian Gurd | -- | -- | |
| Gurd Ian | -- | -- | |
| Gurd Billie | -- | -- | |
| Gurd Billie | -- | -- | |
| Gurd Billie | -- | -- | |
| Gurd Billie | -- | -- | |
| Gurd Irma | -- | -- | |
| Gurd Irma | -- | -- | |
| Billie Gurd | -- | -- |
Source: Public Records
Tax History Compared to Growth
Tax History
| Year | Tax Paid | Tax Assessment Tax Assessment Total Assessment is a certain percentage of the fair market value that is determined by local assessors to be the total taxable value of land and additions on the property. | Land | Improvement |
|---|---|---|---|---|
| 2024 | $1,868 | $36,280 | $2,520 | $33,760 |
| 2023 | $1,844 | $36,280 | $2,520 | $33,760 |
| 2022 | $1,292 | $20,340 | $2,500 | $17,840 |
| 2021 | $1,294 | $20,340 | $2,500 | $17,840 |
| 2020 | $1,301 | $20,340 | $2,500 | $17,840 |
| 2019 | $1,253 | $18,490 | $2,270 | $16,220 |
| 2018 | $1,118 | $18,490 | $2,270 | $16,220 |
| 2017 | $1,115 | $18,490 | $2,270 | $16,220 |
| 2016 | $1,102 | $18,030 | $1,860 | $16,170 |
| 2015 | $1,079 | $18,030 | $1,860 | $16,170 |
| 2014 | $1,083 | $18,030 | $1,860 | $16,170 |
| 2013 | $1,073 | $18,030 | $1,860 | $16,170 |
Source: Public Records
Map
Nearby Homes
- 601 E Western Reserve Rd Unit 1903
- 601 E Western Reserve Rd Unit 701
- 0 Harvard Rd Unit 5038029
- 0 W Harvard Blvd
- 363 Maple Dr
- 695 E Western Reserve Rd Unit 1001
- 331 Warren Ave
- 820 Southwestern Run
- 235 E Western Reserve Rd
- 712 Mcclurg Rd
- 0 W Western Reserve Rd Unit 5146459
- 717 Calla Rd E
- 74 Carter Cir
- 0 Market St Unit 5086675
- 976 Calla Rd E
- 1008 E Calla Rd
- 8129 South Ave
- 9144 Sharrott Rd
- 0 Eaton Unit 5149277
- 8484 Ivy Hill Dr
- 545 Ferncliff Ave
- 546 Ferncliff Ave
- 535 Ferncliff Ave
- 546 Russell Ave
- 523 Ferncliff Ave
- 508 Ferncliff Ave
- 557 Russell Ave
- 508 Russell Ave
- 545 Russell Ave
- 523 E Western Reserve Rd
- 523 Russell Ave
- 538 E Western Reserve Rd
- 9130 Melrose Ave
- 493 E Western Reserve Rd
- 556 Laird Ave
- 546 Laird Ave
- 481 Ferncliff Ave
- 493 Russell Ave
- 514 E Western Reserve Rd
- 508 Laird Ave