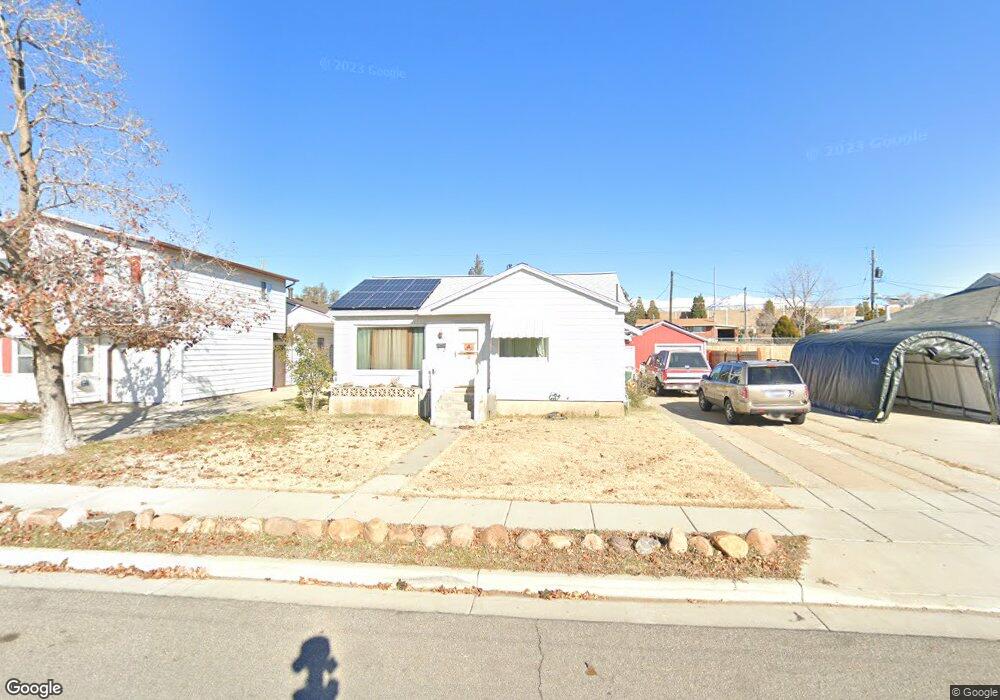
557 Maple St Clearfield, UT 84015
Estimated Value: $326,000 - $364,000
3
Beds
2
Baths
770
Sq Ft
$458/Sq Ft
Est. Value
About This Home
This home is located at 557 Maple St, Clearfield, UT 84015 and is currently estimated at $353,031, approximately $458 per square foot. 557 Maple St is a home located in Davis County with nearby schools including Wasatch Elementary School, North Davis Junior High School, and Clearfield High School.
Ownership History
Date
Name
Owned For
Owner Type
Purchase Details
Closed on
Mar 27, 2024
Sold by
Dangerfield Grant S and Dangerfield Becky J
Bought by
Grant S And Becky J Dangerfield Revocable Liv and Dangerfield
Current Estimated Value
Purchase Details
Closed on
Feb 23, 1998
Sold by
Willerton Mark S
Bought by
Dangerfield Grant S and Dangerfield Becky J
Home Financials for this Owner
Home Financials are based on the most recent Mortgage that was taken out on this home.
Original Mortgage
$75,000
Interest Rate
6.46%
Purchase Details
Closed on
Feb 18, 1998
Sold by
Willerton Becky and Dangerfield Becky J
Bought by
Dangerfield Grant S and Dangerfield Becky J
Home Financials for this Owner
Home Financials are based on the most recent Mortgage that was taken out on this home.
Original Mortgage
$75,000
Interest Rate
6.46%
Create a Home Valuation Report for This Property
The Home Valuation Report is an in-depth analysis detailing your home's value as well as a comparison with similar homes in the area
Home Values in the Area
Average Home Value in this Area
Purchase History
| Date | Buyer | Sale Price | Title Company |
|---|---|---|---|
| Grant S And Becky J Dangerfield Revocable Liv | -- | None Listed On Document | |
| Dangerfield Grant S | -- | Mountain View Title & Escrow | |
| Dangerfield Grant S | -- | Mountain View Title & Escrow |
Source: Public Records
Mortgage History
| Date | Status | Borrower | Loan Amount |
|---|---|---|---|
| Previous Owner | Dangerfield Grant S | $75,000 |
Source: Public Records
Tax History
| Year | Tax Paid | Tax Assessment Tax Assessment Total Assessment is a certain percentage of the fair market value that is determined by local assessors to be the total taxable value of land and additions on the property. | Land | Improvement |
|---|---|---|---|---|
| 2025 | -- | $172,150 | $71,933 | $100,217 |
| 2024 | -- | $172,150 | $68,773 | $103,377 |
| 2023 | $0 | $301,000 | $110,096 | $190,904 |
| 2022 | $1,095 | $173,685 | $63,192 | $110,493 |
| 2021 | $1,095 | $215,000 | $67,057 | $147,943 |
| 2020 | $1,095 | $189,000 | $56,367 | $132,633 |
| 2019 | $1,095 | $178,000 | $59,172 | $118,828 |
| 2018 | $0 | $155,000 | $49,895 | $105,105 |
| 2016 | $1,071 | $72,380 | $20,970 | $51,410 |
| 2015 | $992 | $63,965 | $20,970 | $42,995 |
| 2014 | $898 | $58,674 | $20,970 | $37,704 |
| 2013 | $737 | $46,022 | $22,036 | $23,986 |
Source: Public Records
Map
Nearby Homes
- 565 Maple St
- 549 Maple St
- 549 S Maple St Unit 7
- 573 Maple St
- 541 Maple St
- 541 Maple St Unit Basement
- 541 Maple St Unit Upstairs
- 541 E Maple St
- 554 S Maple St
- 554 Maple St
- 581 Maple St
- 562 Maple St
- 550 Maple St
- 533 Maple St
- 550 E Maple St
- 568 Maple St
- 544 Maple St
- 25 S Terrace Dr
- 37 S Terrace Dr
- 589 Maple St
Your Personal Tour Guide
Ask me questions while you tour the home.