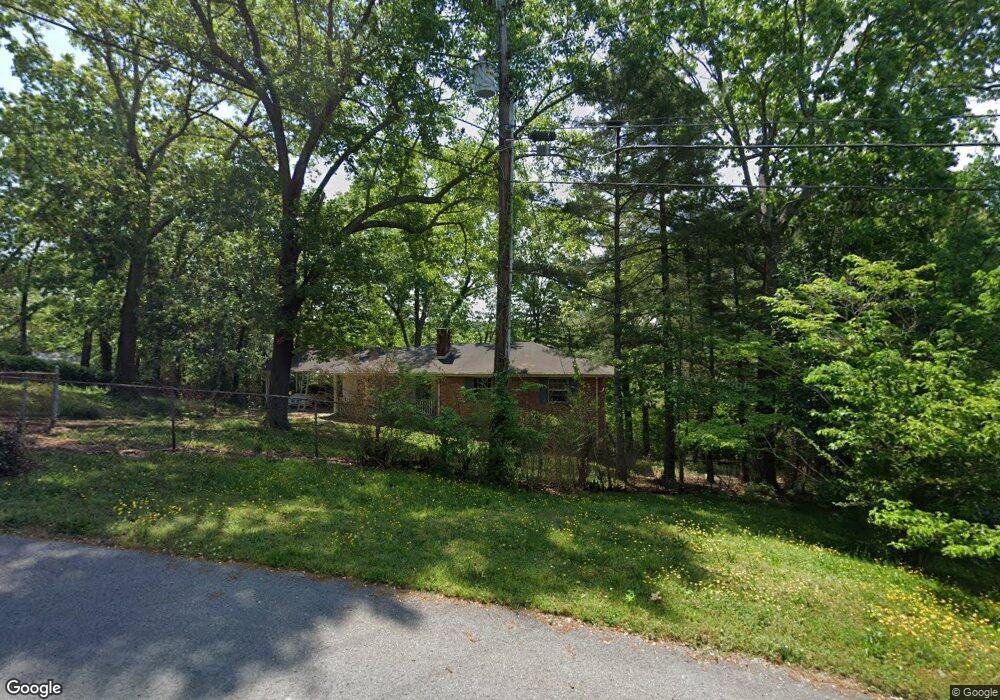
557 Tinker Bell Cir Flintstone, GA 30725
Flintstone NeighborhoodEstimated Value: $230,769 - $314,000
4
Beds
3
Baths
2,215
Sq Ft
$121/Sq Ft
Est. Value
About This Home
This home is located at 557 Tinker Bell Cir, Flintstone, GA 30725 and is currently estimated at $268,442, approximately $121 per square foot. 557 Tinker Bell Cir is a home located in Walker County with nearby schools including Chattanooga Valley Elementary School, Chattanooga Valley Middle School, and Ridgeland High School.
Ownership History
Date
Name
Owned For
Owner Type
Purchase Details
Closed on
Aug 14, 2006
Sold by
Valentin Evelyn
Bought by
Stahl William
Current Estimated Value
Home Financials for this Owner
Home Financials are based on the most recent Mortgage that was taken out on this home.
Original Mortgage
$98,400
Outstanding Balance
$58,788
Interest Rate
6.67%
Mortgage Type
New Conventional
Estimated Equity
$209,654
Purchase Details
Closed on
Jun 17, 2002
Sold by
White Deborah M
Bought by
Valentin Evelyn
Purchase Details
Closed on
May 31, 2002
Sold by
White Wallace F and White Deborah M
Bought by
White Deborah M
Purchase Details
Closed on
Apr 18, 1987
Sold by
Durham Ramona Faye
Bought by
White Wallace F and White Deborah M
Purchase Details
Closed on
Sep 28, 1981
Sold by
Durham S Eugene
Bought by
Durham Ramona Faye
Purchase Details
Closed on
Jun 28, 1967
Bought by
Durham S Eugene
Create a Home Valuation Report for This Property
The Home Valuation Report is an in-depth analysis detailing your home's value as well as a comparison with similar homes in the area
Home Values in the Area
Average Home Value in this Area
Purchase History
| Date | Buyer | Sale Price | Title Company |
|---|---|---|---|
| Stahl William | $123,000 | -- | |
| Valentin Evelyn | $88,000 | -- | |
| White Deborah M | -- | -- | |
| White Wallace F | $54,900 | -- | |
| Durham Ramona Faye | -- | -- | |
| Durham S Eugene | -- | -- |
Source: Public Records
Mortgage History
| Date | Status | Borrower | Loan Amount |
|---|---|---|---|
| Open | Stahl William | $98,400 |
Source: Public Records
Tax History Compared to Growth
Tax History
| Year | Tax Paid | Tax Assessment Tax Assessment Total Assessment is a certain percentage of the fair market value that is determined by local assessors to be the total taxable value of land and additions on the property. | Land | Improvement |
|---|---|---|---|---|
| 2024 | $1,680 | $75,252 | $7,740 | $67,512 |
| 2023 | $1,635 | $71,656 | $7,740 | $63,916 |
| 2022 | $1,434 | $57,846 | $4,300 | $53,546 |
| 2021 | $1,180 | $42,557 | $4,300 | $38,257 |
| 2020 | $1,098 | $38,014 | $4,300 | $33,714 |
| 2019 | $1,118 | $38,014 | $4,300 | $33,714 |
| 2018 | $1,006 | $38,014 | $4,300 | $33,714 |
| 2017 | $1,223 | $38,014 | $4,300 | $33,714 |
| 2016 | $1,011 | $38,014 | $4,300 | $33,714 |
| 2015 | $1,187 | $42,566 | $4,900 | $37,666 |
| 2014 | $1,088 | $42,566 | $4,900 | $37,666 |
| 2013 | -- | $42,565 | $4,900 | $37,665 |
Source: Public Records
Map
Nearby Homes
- 569 Tinker Bell Cir
- 184 Cinderella Dr
- 113 Fox Run Cir N
- 137 Fox Run Cir N
- 4302 Happy Valley Rd
- 4766 Happy Valley Rd
- 76 Saddlebred Way
- 114 Saddlebred Way
- 18 Buck Creek Ln
- 278 Dry Valley Rd
- 306 Dry Valley Rd
- 2937 Happy Valley Rd
- 880 Dry Valley Rd
- 297 Draft St
- 307 Draft St
- 313 Draft St
- 259 Draft St
- 346 Draft St
- 300 Draft St
- 334 Draft St
- 231 Cinderella Dr
- 249 Cinderella Dr
- 527 Tinker Bell Cir
- 566 Tinker Bell Cir
- 27 Glass Slipper Trail
- 187 Cinderella Dr
- 49 Glass Slipper Trail
- 167 Cinderella Dr
- 242 Cinderella Dr
- 518 Tinker Bell Cir
- 145 Cinderella Dr
- 192 Tinker Bell Cir
- 507 Tinker Bell Cir
- 12 Fox Run Cir S
- 71 Glass Slipper Tr
- 0 Cinderella Dr
- 1355 Glass Slipper Trail
- 26 Glass Slipper Trail
- 71 Glass Slipper Trail
- 172 Tinker Bell Cir