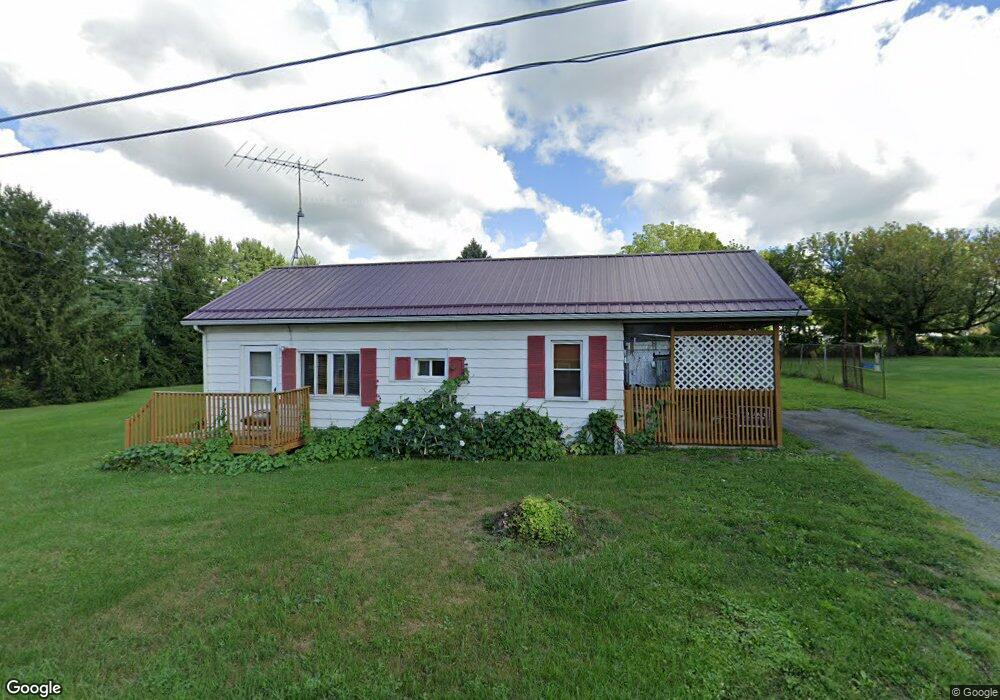
557 Wesley Ave Mansfield, OH 44905
Estimated Value: $86,000 - $97,217
2
Beds
1
Bath
640
Sq Ft
$144/Sq Ft
Est. Value
About This Home
This home is located at 557 Wesley Ave, Mansfield, OH 44905 and is currently estimated at $92,054, approximately $143 per square foot. 557 Wesley Ave is a home located in Richland County with nearby schools including Temple-Christian School, St. Mary Catholic School, and St. Peter's Elementary/Montessori School.
Ownership History
Date
Name
Owned For
Owner Type
Purchase Details
Closed on
Aug 9, 2021
Sold by
Sparks Debra L
Bought by
Sparks Debra L and Lawhun Reed
Current Estimated Value
Purchase Details
Closed on
Jun 16, 2021
Sold by
Sparks Dabra L
Bought by
Sparks William D
Purchase Details
Closed on
Dec 23, 2008
Sold by
Sparks William D and Sparks Debra L
Bought by
Sparks William D and Sparks Debra L
Purchase Details
Closed on
Jun 2, 2008
Sold by
Unknown Heirs Executors Assignee & Admin and Hamilton Bart W
Bought by
Sparks William D
Purchase Details
Closed on
Aug 3, 2001
Sold by
Perkins Carl E
Bought by
Kimble William L
Home Financials for this Owner
Home Financials are based on the most recent Mortgage that was taken out on this home.
Original Mortgage
$26,600
Interest Rate
9.62%
Mortgage Type
New Conventional
Create a Home Valuation Report for This Property
The Home Valuation Report is an in-depth analysis detailing your home's value as well as a comparison with similar homes in the area
Home Values in the Area
Average Home Value in this Area
Purchase History
| Date | Buyer | Sale Price | Title Company |
|---|---|---|---|
| Sparks Debra L | -- | None Available | |
| Sparks William D | -- | -- | |
| Sparks William D | -- | Attorney | |
| Sparks William D | $4,000 | Chicago Title Agency Of Nort | |
| Kimble William L | $28,000 | -- |
Source: Public Records
Mortgage History
| Date | Status | Borrower | Loan Amount |
|---|---|---|---|
| Previous Owner | Kimble William L | $26,600 |
Source: Public Records
Tax History Compared to Growth
Tax History
| Year | Tax Paid | Tax Assessment Tax Assessment Total Assessment is a certain percentage of the fair market value that is determined by local assessors to be the total taxable value of land and additions on the property. | Land | Improvement |
|---|---|---|---|---|
| 2024 | $380 | $16,670 | $3,040 | $13,630 |
| 2023 | $380 | $16,670 | $3,040 | $13,630 |
| 2022 | $200 | $11,710 | $2,880 | $8,830 |
| 2021 | $201 | $11,710 | $2,880 | $8,830 |
| 2020 | $774 | $11,710 | $2,880 | $8,830 |
| 2019 | $1,323 | $10,220 | $2,440 | $7,780 |
| 2018 | $896 | $10,220 | $2,440 | $7,780 |
| 2017 | $723 | $10,220 | $2,440 | $7,780 |
| 2016 | $92 | $9,010 | $2,320 | $6,690 |
| 2015 | $86 | $9,010 | $2,320 | $6,690 |
| 2014 | $1,057 | $9,010 | $2,320 | $6,690 |
| 2012 | $1,046 | $9,480 | $2,440 | $7,040 |
Source: Public Records
Map
Nearby Homes
- 556 Wesley Ave
- 530 Wesley Ave
- 1032 5th Ave
- 564 Bonair Ave
- 988 5th Ave
- 567 Fleming Falls Rd
- 590 Bonair Ave
- 559 Bonair Ave
- 567 Bonair Ave
- 594 Wesley Ave
- 571 Bonair Ave
- 589 Fleming Falls Rd
- 579 Fleming Falls Rd
- 583 Bonair Ave
- 1056 5th Ave
- 597 Fleming Falls Rd
- 960 5th Ave
- 595 Bonair Ave
- 562 Brace Ave
- 570 Fleming Falls Rd