5571 Adobe Falls Rd Unit B San Diego, CA 92120
Del Cerro NeighborhoodEstimated Value: $666,960 - $871,000
3
Beds
2
Baths
1,433
Sq Ft
$514/Sq Ft
Est. Value
About This Home
This home is located at 5571 Adobe Falls Rd Unit B, San Diego, CA 92120 and is currently estimated at $737,240, approximately $514 per square foot. 5571 Adobe Falls Rd Unit B is a home located in San Diego County with nearby schools including Foster Elementary School, Lewis Middle School, and Patrick Henry High School.
Ownership History
Date
Name
Owned For
Owner Type
Purchase Details
Closed on
Oct 22, 2020
Sold by
Whitaker Russell J and Whitaker Catherine
Bought by
Whitaker Russell J and Whitaker Catherine
Current Estimated Value
Purchase Details
Closed on
Dec 13, 2017
Sold by
Santoni Robert M
Bought by
Whitaker Russell J
Purchase Details
Closed on
Dec 10, 1999
Sold by
Baquero Elizabeth C
Bought by
Santoni Robert M
Home Financials for this Owner
Home Financials are based on the most recent Mortgage that was taken out on this home.
Original Mortgage
$135,000
Interest Rate
7.72%
Mortgage Type
Purchase Money Mortgage
Purchase Details
Closed on
Mar 25, 1988
Purchase Details
Closed on
May 25, 1984
Create a Home Valuation Report for This Property
The Home Valuation Report is an in-depth analysis detailing your home's value as well as a comparison with similar homes in the area
Home Values in the Area
Average Home Value in this Area
Purchase History
| Date | Buyer | Sale Price | Title Company |
|---|---|---|---|
| Whitaker Russell J | -- | None Available | |
| Whitaker Russell J | -- | None Available | |
| Whitaker Russell J | $420,000 | Fidelity National Title | |
| Santoni Robert M | $188,000 | First American Title Ins Co | |
| -- | $134,500 | -- | |
| -- | $120,900 | -- |
Source: Public Records
Mortgage History
| Date | Status | Borrower | Loan Amount |
|---|---|---|---|
| Previous Owner | Santoni Robert M | $135,000 |
Source: Public Records
Tax History Compared to Growth
Tax History
| Year | Tax Paid | Tax Assessment Tax Assessment Total Assessment is a certain percentage of the fair market value that is determined by local assessors to be the total taxable value of land and additions on the property. | Land | Improvement |
|---|---|---|---|---|
| 2025 | $5,786 | $477,880 | $152,507 | $325,373 |
| 2024 | $5,786 | $468,511 | $149,517 | $318,994 |
| 2023 | $5,658 | $459,326 | $146,586 | $312,740 |
| 2022 | $5,508 | $450,320 | $143,712 | $306,608 |
| 2021 | $5,470 | $441,492 | $140,895 | $300,597 |
| 2020 | $5,404 | $436,966 | $139,451 | $297,515 |
| 2019 | $5,308 | $428,399 | $136,717 | $291,682 |
| 2018 | $2,931 | $253,936 | $81,040 | $172,896 |
| 2017 | $2,860 | $248,957 | $79,451 | $169,506 |
| 2016 | $2,812 | $244,077 | $77,894 | $166,183 |
| 2015 | $2,770 | $240,411 | $76,724 | $163,687 |
| 2014 | $2,725 | $235,703 | $75,222 | $160,481 |
Source: Public Records
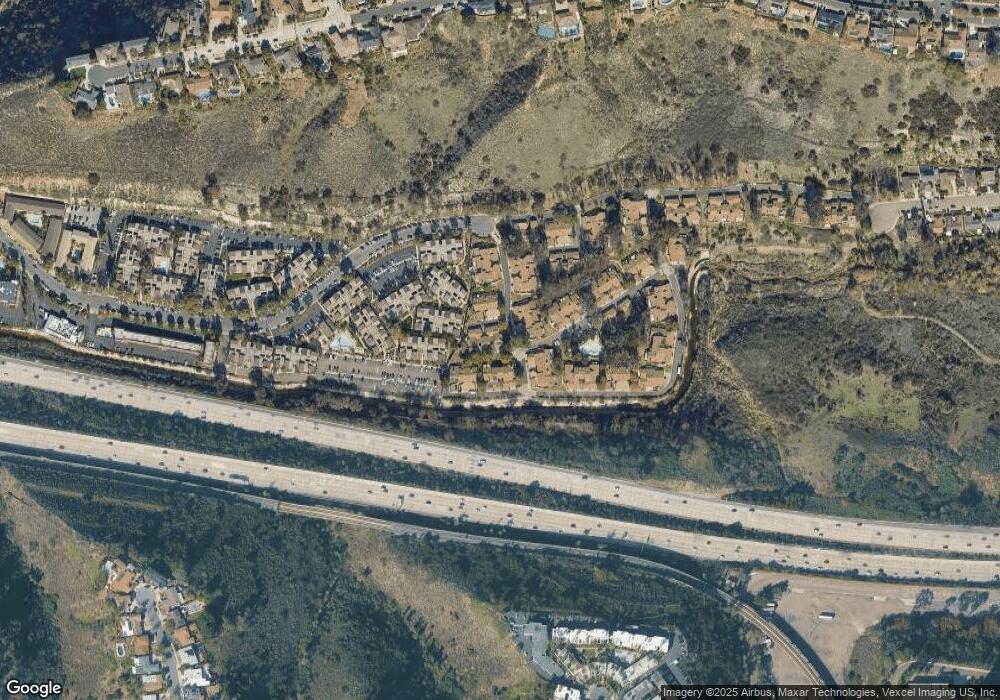
Map
Nearby Homes
- 5513 Adobe Falls Rd Unit 11
- 5432 Adobe Falls Rd Unit 12
- 6543 Carthage St
- 5540 Lindo Paseo Unit 19
- 5665 Toyon Rd Unit 27
- 6549 Glenroy St
- 6183 Rockhurst Dr
- 6196 Rockhurst Dr
- 6016 Wenrich Place
- 6391 Estrella Ave
- 6182 Loukelton Cir
- 4701 Elsa Rd
- 4940 Defiance Way
- 5045 Collwood Way Unit 33
- 5996 College Ave
- 6817 Birchwood St
- 6057 Delor Ct
- 5556 Baja Dr
- 4664 Yerba Santa Dr
- 4881 Collwood Blvd Unit A
- 5571 Adobe Falls Rd
- 5563 Adobe Falls Rd Unit A
- 5571 Adobe Falls Rd Unit D
- 5571 Adobe Falls Rd Unit C
- 5571 Adobe Falls Rd Unit A
- 5581 Adobe Falls Rd Unit A
- 5581 Adobe Falls Rd Unit B
- 5581 Adobe Falls Rd Unit C
- 5581 Adobe Falls Rd Unit D
- 5587 Adobe Falls Rd Unit D
- 5587 Adobe Falls Rd Unit C
- 5587 Adobe Falls Rd Unit B
- 5587 Adobe Falls Rd Unit A
- 5601 Adobe Falls Rd Unit C
- 5601 Adobe Falls Rd Unit B
- 5601 Adobe Falls Rd Unit A
- 5563 Adobe Falls Rd Unit D
- 5563 Adobe Falls Rd Unit C
- 5563 Adobe Falls Rd Unit B
- 5577 Adobe Falls Rd Unit D