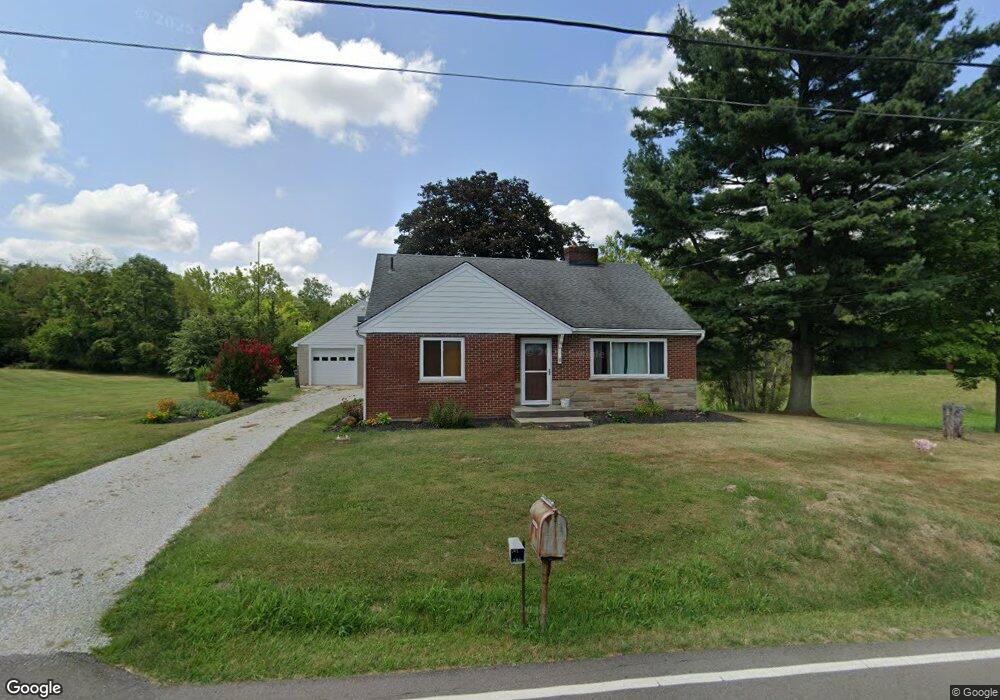
5575 Brushy Fork Rd Batavia, OH 45103
Estimated Value: $228,000 - $231,593
2
Beds
1
Bath
1,048
Sq Ft
$219/Sq Ft
Est. Value
About This Home
This home is located at 5575 Brushy Fork Rd, Batavia, OH 45103 and is currently estimated at $229,797, approximately $219 per square foot. 5575 Brushy Fork Rd is a home located in Clermont County with nearby schools including Clermont Northeastern Elementary School, Clermont Northeastern Middle School, and Clermont Northeastern High School.
Ownership History
Date
Name
Owned For
Owner Type
Purchase Details
Closed on
Jul 6, 2017
Sold by
Blevins Earl J
Bought by
Blevins Loretta E
Current Estimated Value
Home Financials for this Owner
Home Financials are based on the most recent Mortgage that was taken out on this home.
Original Mortgage
$106,250
Outstanding Balance
$54,655
Interest Rate
3.16%
Mortgage Type
New Conventional
Estimated Equity
$175,142
Purchase Details
Closed on
Jun 7, 2017
Sold by
Blevins Loretta E and The Blevins Family Trust
Bought by
Runyon Travis J
Home Financials for this Owner
Home Financials are based on the most recent Mortgage that was taken out on this home.
Original Mortgage
$106,250
Outstanding Balance
$54,655
Interest Rate
3.16%
Mortgage Type
New Conventional
Estimated Equity
$175,142
Purchase Details
Closed on
Aug 29, 2008
Sold by
Blevins Loretta and Blevins Earl J
Bought by
Blevins Earl J and Blevins Loretta E
Create a Home Valuation Report for This Property
The Home Valuation Report is an in-depth analysis detailing your home's value as well as a comparison with similar homes in the area
Home Values in the Area
Average Home Value in this Area
Purchase History
| Date | Buyer | Sale Price | Title Company |
|---|---|---|---|
| Blevins Loretta E | -- | None Available | |
| Runyon Travis J | $125,000 | None Available | |
| Blevins Earl J | -- | Attorney |
Source: Public Records
Mortgage History
| Date | Status | Borrower | Loan Amount |
|---|---|---|---|
| Open | Blevins Loretta E | $106,250 | |
| Closed | Runyon Travis J | $106,250 |
Source: Public Records
Tax History Compared to Growth
Tax History
| Year | Tax Paid | Tax Assessment Tax Assessment Total Assessment is a certain percentage of the fair market value that is determined by local assessors to be the total taxable value of land and additions on the property. | Land | Improvement |
|---|---|---|---|---|
| 2024 | $1,881 | $74,730 | $49,350 | $25,380 |
| 2023 | $1,882 | $74,730 | $49,350 | $25,380 |
| 2022 | $1,799 | $74,730 | $49,350 | $25,380 |
| 2021 | $1,697 | $74,730 | $49,350 | $25,380 |
| 2020 | $1,695 | $74,730 | $49,350 | $25,380 |
| 2019 | $1,583 | $65,110 | $44,770 | $20,340 |
| 2018 | $1,583 | $65,110 | $44,770 | $20,340 |
| 2017 | $1,572 | $64,090 | $43,750 | $20,340 |
| 2016 | $1,694 | $54,570 | $38,050 | $16,520 |
| 2015 | $1,463 | $54,570 | $38,050 | $16,520 |
| 2014 | $1,463 | $69,830 | $53,310 | $16,520 |
| 2013 | $1,259 | $50,190 | $33,110 | $17,080 |
Source: Public Records
Map
Nearby Homes
- 2943 U S 50
- 2650 U S 50
- 2641 U S 50
- 0 Bigam Rd Unit 1847369
- 5445 Belle Meade Dr
- 2641 Highway 50
- 3003 Quitter Rd
- ac Quitter Rd
- 2644 Ohio 131
- 3294 Ohio 131
- 1 Highway 50
- 2370 St Rt 131
- 33 Sutton Ln
- 5979 Belfast Rd
- 1211 Church Hill Farms
- B Clemons Rd
- C Clemons Rd
- 5025 St Rt 132
- 5952 Stonelick Creek Ln
- 6075 Belfast Rd
- 5566 Brushy Fork Rd
- 5549 Brushy Fork Rd
- 0 Millers Run Rd Unit 1571041
- 0 Millers Run Rd Unit 1391090
- 0 Millers Run Rd Unit C 1391107
- 0 Millers Run Rd Unit C 1461589
- 0 Millers Run Rd Unit B 1461568
- 0 Millers Run Rd Unit 1461544
- 0 Millers Run Rd Unit 1510656
- 6.78ac Millers Run Rd
- 9.856ac Millers Run Rd
- 2707 Bergen Rd
- 5566 Aulen Rd
- 5558 Aulen Rd
- 5614 Aulen Rd
- 3726 Millers Run
- 5554 Aulen Rd
- 5545 Brushy Fork Rd
- 2598 Miller Rd
- 5550 Aulen Rd