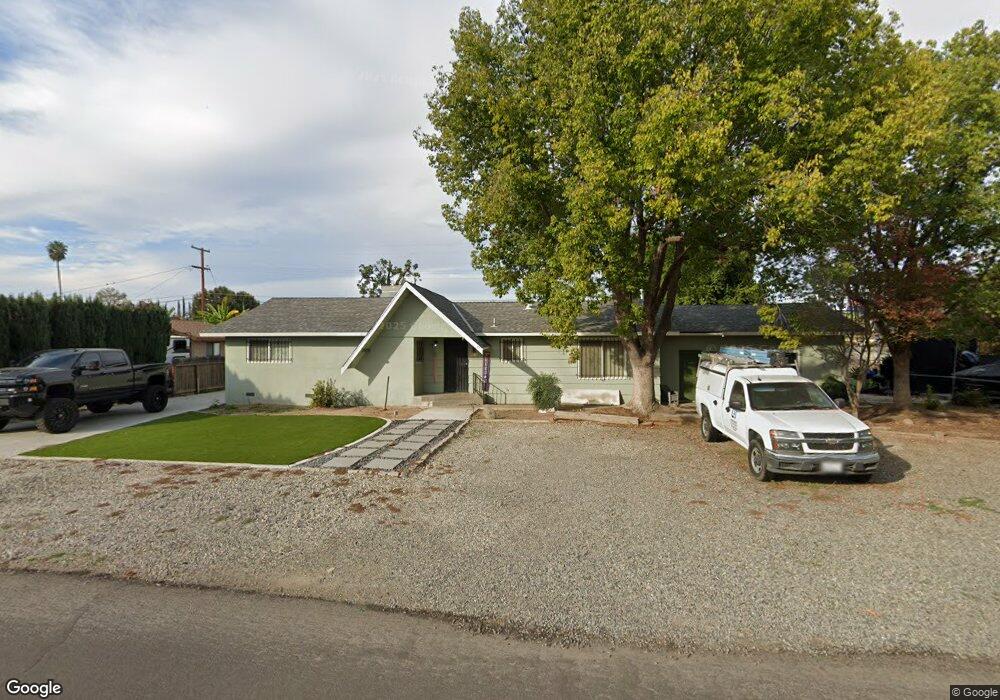
5575 E Pontiac Way Fresno, CA 93727
Tarpey NeighborhoodEstimated Value: $367,000 - $429,000
3
Beds
2
Baths
1,524
Sq Ft
$253/Sq Ft
Est. Value
About This Home
This home is located at 5575 E Pontiac Way, Fresno, CA 93727 and is currently estimated at $384,873, approximately $252 per square foot. 5575 E Pontiac Way is a home located in Fresno County with nearby schools including Tarpey Elementary School, Alta Sierra Intermediate School, and Buchanan High School.
Ownership History
Date
Name
Owned For
Owner Type
Purchase Details
Closed on
Sep 10, 2021
Sold by
Morris Bernard E and Morris Linda J
Bought by
Williams Gerald W
Current Estimated Value
Home Financials for this Owner
Home Financials are based on the most recent Mortgage that was taken out on this home.
Original Mortgage
$294,566
Interest Rate
2.88%
Mortgage Type
FHA
Purchase Details
Closed on
May 14, 2020
Sold by
Morris Linda Jean
Bought by
Morris Bernard E and Morris Linda J
Purchase Details
Closed on
Mar 30, 2020
Sold by
Morris Linda Jean and The Thornton Revocable Living
Bought by
Morris Linda Jean
Purchase Details
Closed on
Nov 6, 2019
Sold by
Thornton Era Valerie and Era Valerie Thornton Trust
Bought by
Morris Linda Jean and The Thornton Revocable Living
Purchase Details
Closed on
Jan 24, 1997
Sold by
Thornton Era V
Bought by
Thornton Era Valerie
Create a Home Valuation Report for This Property
The Home Valuation Report is an in-depth analysis detailing your home's value as well as a comparison with similar homes in the area
Home Values in the Area
Average Home Value in this Area
Purchase History
| Date | Buyer | Sale Price | Title Company |
|---|---|---|---|
| Williams Gerald W | $300,000 | Old Republic Title Company | |
| Morris Bernard E | -- | None Available | |
| Morris Linda Jean | -- | None Available | |
| Morris Linda Jean | -- | None Available | |
| Thornton Era Valerie | -- | -- |
Source: Public Records
Mortgage History
| Date | Status | Borrower | Loan Amount |
|---|---|---|---|
| Previous Owner | Williams Gerald W | $294,566 |
Source: Public Records
Tax History Compared to Growth
Tax History
| Year | Tax Paid | Tax Assessment Tax Assessment Total Assessment is a certain percentage of the fair market value that is determined by local assessors to be the total taxable value of land and additions on the property. | Land | Improvement |
|---|---|---|---|---|
| 2025 | $3,763 | $318,361 | $87,018 | $231,343 |
| 2023 | $3,620 | $306,000 | $83,640 | $222,360 |
| 2022 | $3,572 | $300,000 | $82,000 | $218,000 |
| 2021 | $889 | $74,001 | $18,751 | $55,250 |
| 2020 | $803 | $73,243 | $18,559 | $54,684 |
| 2019 | $786 | $71,808 | $18,196 | $53,612 |
| 2018 | $768 | $70,401 | $17,840 | $52,561 |
| 2017 | $753 | $69,022 | $17,491 | $51,531 |
| 2016 | $727 | $67,670 | $17,149 | $50,521 |
| 2015 | $715 | $66,655 | $16,892 | $49,763 |
| 2014 | $700 | $65,351 | $16,562 | $48,789 |
Source: Public Records
Map
Nearby Homes
- 5675 E Ashlan Ave
- 4065 N Eddy Ave
- 5703 E Hampton Way
- 5588 E National Ave
- 5658 E Bernadine Dr
- 5739 E Hampton Way
- 3605 Phillip Ave
- 3734 Manila Ave
- 91 W Richert Ave
- 3556 N Duke Ave Unit 165
- 2932 Claremont Ave
- 3550 N Duke Ave Unit 37
- 3550 N Duke Ave Unit 10
- 3550 N Duke Ave Unit 12
- 1438 Indianapolis Ave
- 371 W Swift Ave
- 5934 E Dakota Ave
- 1717 Swift Ave
- 6402 E Millie Dr
- 394 W Ashcroft Ave
- 5588 E Griffith Way
- 5565 E Pontiac Way
- 5595 E Pontiac Way
- 5564 E Griffith Way
- 5580 E Pontiac Way
- 5568 E Pontiac Way
- 3917 N Clovis Ave
- 5555 E Pontiac Way
- 5558 E Pontiac Way
- 5556 E Griffith Way
- 5579 E Saginaw Way
- 5569 E Saginaw Way
- 5575 E Griffith Way
- 3909 N Clovis Ave
- 5559 E Saginaw Way
- 5548 E Pontiac Way
- 5555 E Griffith Way
- 5547 E Pontiac Way
- 5546 E Griffith Way
- 4076 N Hammel Way