Estimated Value: $375,000 - $438,599
3
Beds
2
Baths
2,445
Sq Ft
$164/Sq Ft
Est. Value
About This Home
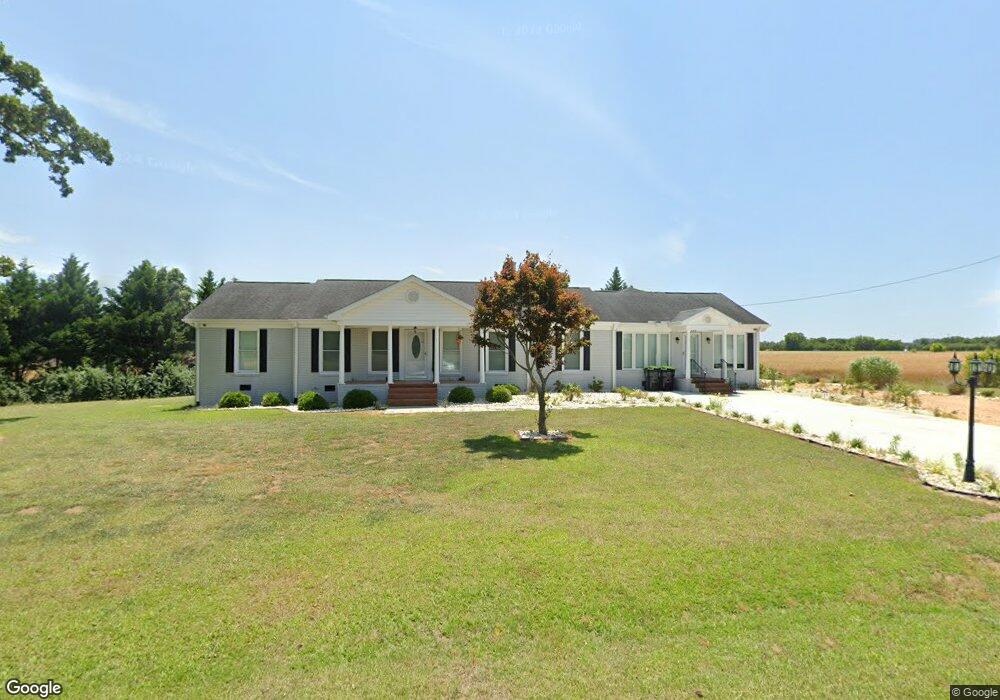
This home is located at 5575 Strawpond Schoo Rd, Dunn, NC 28334 and is currently estimated at $401,400, approximately $164 per square foot. 5575 Strawpond Schoo Rd is a home located in Sampson County with nearby schools including Midway Elementary School, Midway Middle School, and Midway High School.
Ownership History
Date
Name
Owned For
Owner Type
Purchase Details
Closed on
Dec 12, 2022
Sold by
Honeycutt Herbie Robert
Bought by
Nagengast Joseph D and Nagengast Elizabeth Rogers
Current Estimated Value
Home Financials for this Owner
Home Financials are based on the most recent Mortgage that was taken out on this home.
Original Mortgage
$375,032
Outstanding Balance
$359,126
Interest Rate
5%
Mortgage Type
VA
Estimated Equity
$42,274
Purchase Details
Closed on
Sep 28, 2010
Sold by
Deutsche Bank National Trust Co
Bought by
Honeycutt Herbie Robert and Honeycutt Ann P
Purchase Details
Closed on
Dec 19, 2009
Sold by
Blue Ivory and Blue Rebecca
Bought by
Deutsche Bank National Trust Co
Purchase Details
Closed on
Jan 21, 2008
Sold by
Siler James D and Siler Pamela H
Bought by
Blue Ivory Joe and Blue Rebecca Dalton
Home Financials for this Owner
Home Financials are based on the most recent Mortgage that was taken out on this home.
Original Mortgage
$10,794
Interest Rate
6.06%
Mortgage Type
Purchase Money Mortgage
Create a Home Valuation Report for This Property
The Home Valuation Report is an in-depth analysis detailing your home's value as well as a comparison with similar homes in the area
Home Values in the Area
Average Home Value in this Area
Purchase History
| Date | Buyer | Sale Price | Title Company |
|---|---|---|---|
| Nagengast Joseph D | $362,000 | -- | |
| Honeycutt Herbie Robert | $65,000 | -- | |
| Deutsche Bank National Trust Co | $89,500 | None Available | |
| Blue Ivory Joe | $10,000 | -- |
Source: Public Records
Mortgage History
| Date | Status | Borrower | Loan Amount |
|---|---|---|---|
| Open | Nagengast Joseph D | $375,032 | |
| Previous Owner | Blue Ivory Joe | $10,794 |
Source: Public Records
Tax History Compared to Growth
Tax History
| Year | Tax Paid | Tax Assessment Tax Assessment Total Assessment is a certain percentage of the fair market value that is determined by local assessors to be the total taxable value of land and additions on the property. | Land | Improvement |
|---|---|---|---|---|
| 2025 | $3,269 | $416,373 | $14,875 | $401,498 |
| 2024 | $2,915 | $416,373 | $14,875 | $401,498 |
| 2023 | $2,782 | $300,747 | $12,934 | $287,813 |
| 2022 | $1,855 | $200,540 | $12,934 | $187,606 |
| 2021 | $1,855 | $200,540 | $12,934 | $187,606 |
| 2020 | $1,855 | $200,540 | $12,934 | $187,606 |
| 2019 | $1,855 | $200,540 | $0 | $0 |
| 2018 | $1,780 | $192,429 | $0 | $0 |
| 2017 | $1,780 | $192,429 | $0 | $0 |
| 2016 | $1,790 | $192,429 | $0 | $0 |
| 2015 | $1,790 | $192,429 | $0 | $0 |
| 2014 | $1,790 | $192,429 | $0 | $0 |
Source: Public Records
Map
Nearby Homes
- 16381 Dunn Rd
- 0 Old Tower Rd
- 174 Covenant Ln
- 80 Covenant Ln
- 3570 Penny Tew Mill Rd
- 3000 Wrench Rd
- 72 Sanford Ln
- 0 Glover Rd
- 97 Sawyer Mill Dr
- 34 Merlin Ct
- 125 Heron Ct
- 4285 Autry Mill Rd
- 899 Core Rd
- 260 Naylor School Rd
- 8 Sanford Ln
- 623 O B J Rd
- 40 Breckenridge Place
- 879 O B J Rd
- 1965 Green Path Rd
- 0 Welcome School Rd
- 5575 Straw Pond School Rd
- 5594 Straw Pond School Rd
- 5510 Straw Pond School Rd
- 5700 Straw Pond School Rd
- 5660 Straw Pond School Rd
- 15917 Dunn Rd
- 15937 Dunn Rd
- 309 Straw Pond School Rd
- 15495 Dunn Rd
- 15440 Dunn Rd
- 16103 Dunn Rd
- 190 Bird Dog Tew Ln
- 16130 Dunn Rd
- 15437 Dunn Rd
- 15401 Dunn Rd
- 15376 Dunn Rd
- 68 Velna Jackson Ln
- 15367 Dunn Rd
- 65 Velna Jackson Ln
- 5056 Straw Pond School Rd