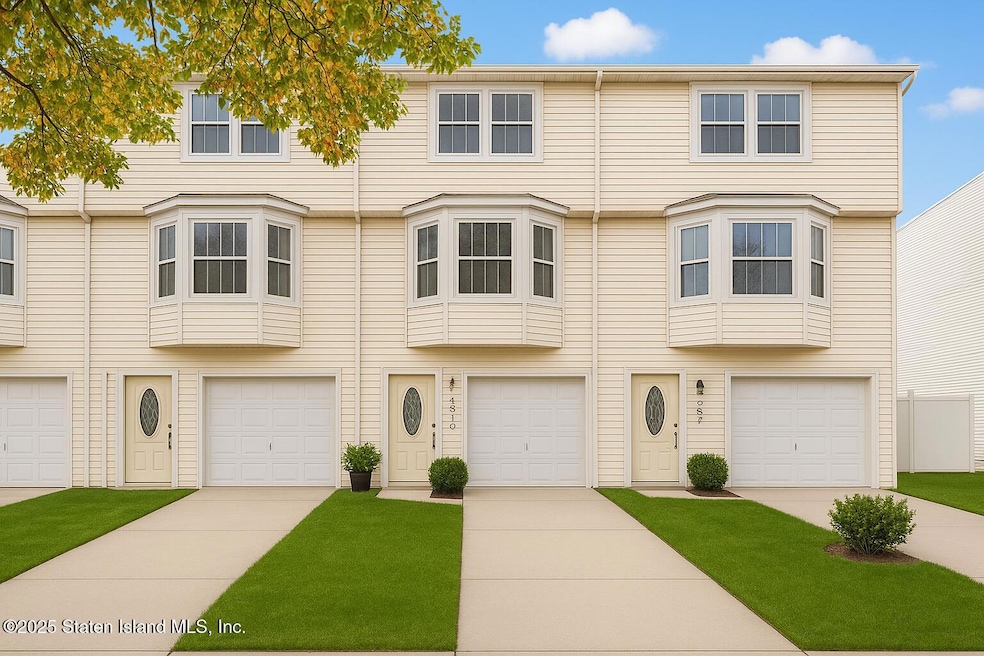
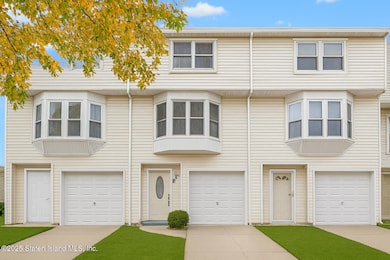
558 Dongan Hills Ave Unit 14A2 Staten Island, NY 10305
Ocean Breeze NeighborhoodEstimated payment $4,412/month
Highlights
- Deck
- Separate Formal Living Room
- Eat-In Kitchen
- P.S. 052 John C. Thompson Rated A
- 1 Car Attached Garage
- Cooling Available
About This Home
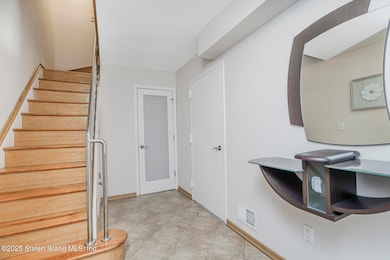
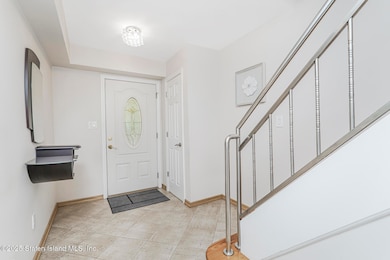
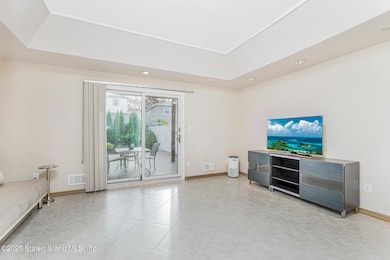
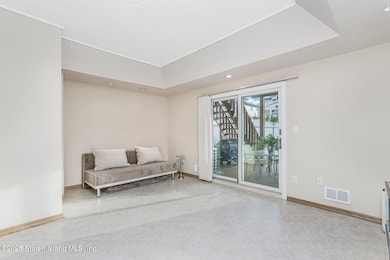
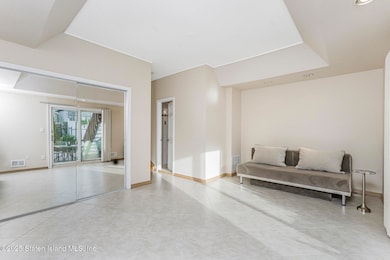
Welcome to 558 Dongan Hills Avenue! This spacious, beautifully maintained 1-family, 3-bedrooms, 3-bathrooms, condo/townhome with a garage, large deck, and private backyard is in excellent move-in condition. The home offers a warm and inviting layout with quality finishes throughout, including hardwood floors, custom kitchen cabinetry, and stainless-steel appliances. Additional highlights include, a large master bedroom with high ceilings and dual entry to bath, and a big family room with bathroom and access to yard.
The HOA provides exceptional convenience, covering exterior maintenance including the roof, gutters, siding, sidewalks, water bill, and flood insurance, ensuring low-maintenance living. Perfectly situated in prime Dongan Hills, this home offers the ideal blend of comfort and convenience, just minutes from the Verrazano Bridge, public transportation, schools, parks, beaches, shopping, restaurants, and the scenic South Beach Boardwalk.
Open House Schedule
-
Sunday, November 16, 202511:00 am to 1:00 pm11/16/2025 11:00:00 AM +00:0011/16/2025 1:00:00 PM +00:00Add to Calendar
Home Details
Home Type
- Single Family
Est. Annual Taxes
- $4,716
Year Built
- Built in 1987
Lot Details
- 1,800 Sq Ft Lot
- Lot Dimensions are 18 x 100
- Fenced
- Back and Front Yard
- Property is zoned R3-1
HOA Fees
- $330 Monthly HOA Fees
Parking
- 1 Car Attached Garage
- Carport
Home Design
- Vinyl Siding
Interior Spaces
- 1,717 Sq Ft Home
- 3-Story Property
- Separate Formal Living Room
- Combination Kitchen and Dining Room
Kitchen
- Eat-In Kitchen
- Microwave
Bedrooms and Bathrooms
- 3 Bedrooms
- Primary Bathroom is a Full Bathroom
Outdoor Features
- Deck
Utilities
- Cooling Available
- Forced Air Heating System
- Heating System Uses Natural Gas
- 220 Volts
Community Details
- Association fees include snow removal
- Tw Finnerty Association
Listing and Financial Details
- Legal Lot and Block 1014 / 03750
- Assessor Parcel Number 03750-1014
Map
Home Values in the Area
Average Home Value in this Area
Tax History
| Year | Tax Paid | Tax Assessment Tax Assessment Total Assessment is a certain percentage of the fair market value that is determined by local assessors to be the total taxable value of land and additions on the property. | Land | Improvement |
|---|---|---|---|---|
| 2025 | $4,944 | $41,509 | $976 | $40,533 |
| 2024 | $4,944 | $34,064 | $1,126 | $32,938 |
| 2023 | $4,716 | $23,220 | $1,141 | $22,079 |
| 2022 | $4,582 | $28,244 | $1,559 | $26,685 |
| 2021 | $4,558 | $24,998 | $1,559 | $23,439 |
| 2020 | $4,584 | $25,677 | $1,559 | $24,118 |
| 2019 | $4,291 | $22,544 | $1,559 | $20,985 |
| 2018 | $3,944 | $19,350 | $1,197 | $18,153 |
| 2017 | $3,899 | $19,128 | $1,284 | $17,844 |
| 2016 | $3,298 | $18,047 | $1,280 | $16,767 |
| 2015 | $2,651 | $18,047 | $1,469 | $16,578 |
| 2014 | $2,651 | $18,311 | $1,491 | $16,820 |
Property History
| Date | Event | Price | List to Sale | Price per Sq Ft |
|---|---|---|---|---|
| 11/10/2025 11/10/25 | For Sale | $699,900 | -- | $408 / Sq Ft |
Purchase History
| Date | Type | Sale Price | Title Company |
|---|---|---|---|
| Bargain Sale Deed | $344,760 | First American Title Ins Co | |
| Bargain Sale Deed | $289,900 | -- |
Mortgage History
| Date | Status | Loan Amount | Loan Type |
|---|---|---|---|
| Open | $215,000 | New Conventional | |
| Previous Owner | $231,900 | Purchase Money Mortgage |
Source: Staten Island Multiple Listing Service
MLS Number: 2506560
APN: 03750-1014
Disclaimer: Certain information contained herein is derived from information provided by parties other than Homes.com. All information provided is deemed reliable, but is not guaranteed to be accurate and should be independently verified.
![]() Certain real estate listing data is provided by Staten Island MLS under its Internet Data Exchange program. This data is provided exclusively for consumers’ personal, non-commercial use and may only be used for identifying prospective properties consumers may be interested in purchasing or renting. Any other use of the data is hereby prohibited. Data deemed reliable but is not guaranteed accurate by Staten Island MLS and should be independently verified. Copyright 2025 Staten Island Multiple Listing Service, Inc. All rights reserved.
Certain real estate listing data is provided by Staten Island MLS under its Internet Data Exchange program. This data is provided exclusively for consumers’ personal, non-commercial use and may only be used for identifying prospective properties consumers may be interested in purchasing or renting. Any other use of the data is hereby prohibited. Data deemed reliable but is not guaranteed accurate by Staten Island MLS and should be independently verified. Copyright 2025 Staten Island Multiple Listing Service, Inc. All rights reserved.
- 568 Dongan Hills Ave Unit 19A1
- 431 Patterson Ave
- 498 Dongan Hills Ave
- 473 Dongan Hills Ave
- 602 Seaview Ave
- 521 Buel Ave
- 467 Dongan Hills Ave
- 519 Buel Ave
- 517 Buel Ave
- 228 Slater Blvd
- 45 Iona St
- 795 Father Capodanno Blvd
- 797 Father Capodanno Blvd
- 799 Father Capodanno Blvd
- 0 Quincy Ave
- 762 Seaview Ave
- 188 Graham Blvd Unit B
- 00 Baden Place
- 0 Baden Place Unit 2503276
- 9 Iroquois St
- 453 Dongan Hills Ave
- 450 Jefferson Ave Unit 2nd Fl
- 450 Jefferson Ave Unit Second floor
- 50 Boundary Ave Unit 1st Floor
- 481 Father Capodanno Blvd Unit N
- 481 Father Capodanno Blvd Unit Furnished Studio
- 34 Zwicky Ave
- 287 Lamport Blvd Unit 2
- 193 Jerome Ave Unit 1st floor
- 90 Hickory Ave
- 1186 Hylan Blvd Unit 2
- 2052 Richmond Rd
- 2052 Richmond Rd Unit Bsmt
- 122 Prescott Ave
- 65 Prescott Ave Unit 2fl
- 28 Jackson Ave Unit 2
- 80 Sheridan Ave
- 578 Oder Ave
- 350 Beach Ave
- 65 Rose Ave Unit 2
