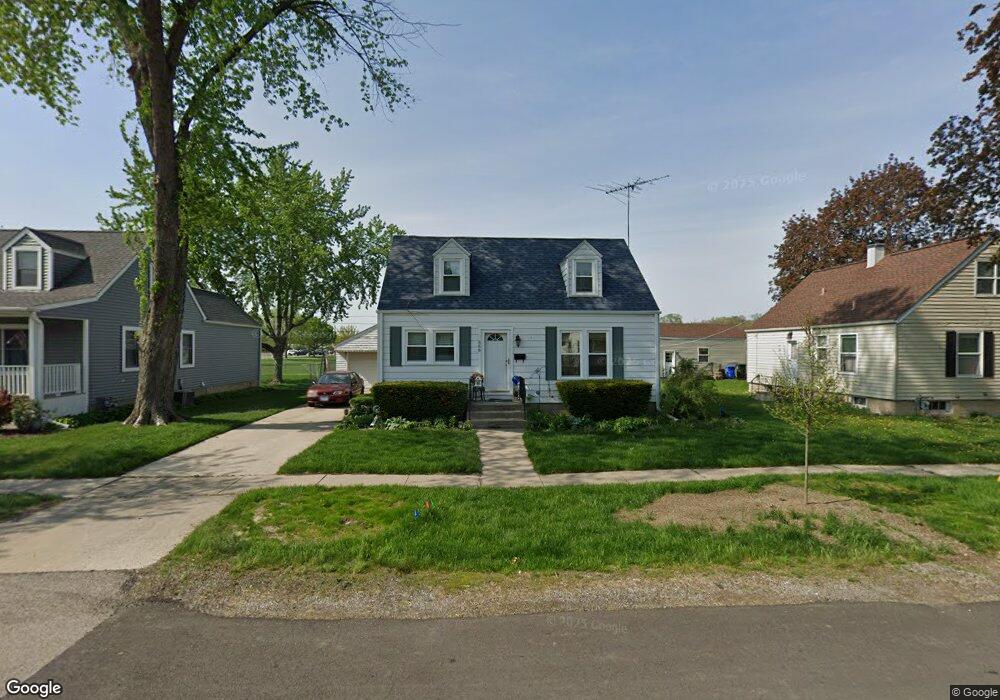
558 E Edwards Ave East Dundee, IL 60118
Estimated Value: $254,382 - $303,000
3
Beds
--
Bath
1,080
Sq Ft
$264/Sq Ft
Est. Value
About This Home
This home is located at 558 E Edwards Ave, East Dundee, IL 60118 and is currently estimated at $284,596, approximately $263 per square foot. 558 E Edwards Ave is a home located in Kane County with nearby schools including Parkview Elementary School, Carpentersville Middle School, and Dundee-Crown High School.
Ownership History
Date
Name
Owned For
Owner Type
Purchase Details
Closed on
May 22, 2000
Sold by
Bona Hurley Bronwyn T and Hurley Craig A
Bought by
Loquercio Gina
Current Estimated Value
Home Financials for this Owner
Home Financials are based on the most recent Mortgage that was taken out on this home.
Original Mortgage
$144,098
Outstanding Balance
$49,925
Interest Rate
8.18%
Mortgage Type
FHA
Estimated Equity
$234,671
Purchase Details
Closed on
Apr 25, 1998
Sold by
Bona Hurley Bronwyn T and Bona Bronwyn T
Bought by
Hurley Craig A and Bona Hurley Bronwyn T
Home Financials for this Owner
Home Financials are based on the most recent Mortgage that was taken out on this home.
Original Mortgage
$46,000
Interest Rate
7.18%
Purchase Details
Closed on
Aug 15, 1996
Sold by
Forster James C and Forster Shirley M
Bought by
Bona Bronwyn T
Home Financials for this Owner
Home Financials are based on the most recent Mortgage that was taken out on this home.
Original Mortgage
$112,500
Interest Rate
8.18%
Create a Home Valuation Report for This Property
The Home Valuation Report is an in-depth analysis detailing your home's value as well as a comparison with similar homes in the area
Home Values in the Area
Average Home Value in this Area
Purchase History
| Date | Buyer | Sale Price | Title Company |
|---|---|---|---|
| Loquercio Gina | $146,000 | First American Title Ins Co | |
| Hurley Craig A | -- | -- | |
| Bona Bronwyn T | $119,000 | -- |
Source: Public Records
Mortgage History
| Date | Status | Borrower | Loan Amount |
|---|---|---|---|
| Open | Loquercio Gina | $144,098 | |
| Previous Owner | Hurley Craig A | $46,000 | |
| Previous Owner | Bona Bronwyn T | $112,500 |
Source: Public Records
Tax History
| Year | Tax Paid | Tax Assessment Tax Assessment Total Assessment is a certain percentage of the fair market value that is determined by local assessors to be the total taxable value of land and additions on the property. | Land | Improvement |
|---|---|---|---|---|
| 2024 | $4,824 | $71,703 | $16,013 | $55,690 |
| 2023 | $4,749 | $64,516 | $14,408 | $50,108 |
| 2022 | $4,540 | $58,142 | $14,408 | $43,734 |
| 2021 | $4,248 | $54,898 | $13,604 | $41,294 |
| 2020 | $4,172 | $53,664 | $13,298 | $40,366 |
| 2019 | $4,063 | $50,944 | $12,624 | $38,320 |
| 2018 | $4,350 | $51,833 | $12,374 | $39,459 |
| 2017 | $4,153 | $48,487 | $11,575 | $36,912 |
| 2016 | $4,105 | $45,313 | $17,539 | $27,774 |
| 2015 | -- | $42,460 | $16,435 | $26,025 |
| 2014 | -- | $41,287 | $15,981 | $25,306 |
| 2013 | -- | $42,551 | $16,470 | $26,081 |
Source: Public Records
Map
Nearby Homes
- 206 Water St
- 436 Barrington Ave
- Lot 8 Elmwood Dr
- 408 Jackson St
- 305 Oregon Ave
- Lot 6B Ravine Rd
- Lot 6A Ravine Rd
- Lot 6 Ravine Rd
- 1 S Lincoln Ave
- 142 Cottage Ave
- 605 Barrington Ave Unit 140
- 605 Barrington Ave Unit 216
- 605 Barrington Ave Unit 208
- 315 Liberty St
- 491 Maple Ave
- Lot 5-7 Cottage Ave
- 1033 Rosewood Dr
- 1203 Brookdale Dr
- 1017 Brookdale Dr Unit 1017
- 1244 Brookdale Dr
- 552 E Edwards Ave
- 560 E Edwards Ave
- 546 E Edwards Ave
- 559 E Edwards Ave
- 540 E Edwards Ave
- 563 E Edwards Ave
- 551 E Edwards Ave
- 547 E Edwards Ave
- 534 E Edwards Ave
- 543 E Edwards Ave
- 531 E Edwards Ave
- 526 E Edwards Ave
- 458 Illinois St
- 448 Illinois St
- 442 Illinois St
- 202 E 2nd St
- 438 Illinois St
- 520 E Edwards Ave
- 428 Illinois St Unit 1
- 201 E 2nd St