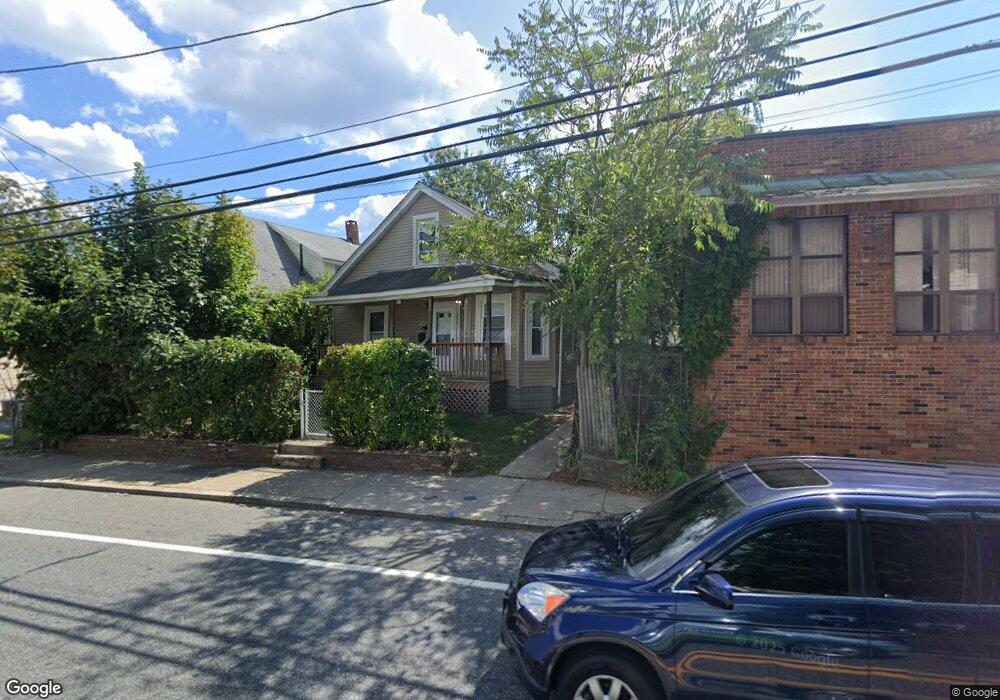
558 Manton Ave Providence, RI 02909
Olneyville NeighborhoodEstimated Value: $306,702
3
Beds
1
Bath
925
Sq Ft
$332/Sq Ft
Est. Value
About This Home
This home is located at 558 Manton Ave, Providence, RI 02909 and is currently estimated at $306,702, approximately $331 per square foot. 558 Manton Ave is a home located in Providence County with nearby schools including Achievement First Promesa, Achievement First Providence Mayoral Academy Elementary School, and Achievement First Providence Mayoral Academy Elementary.
Ownership History
Date
Name
Owned For
Owner Type
Purchase Details
Closed on
May 2, 2006
Sold by
Santurri Richard
Bought by
Communitiew People Inc
Current Estimated Value
Home Financials for this Owner
Home Financials are based on the most recent Mortgage that was taken out on this home.
Original Mortgage
$162,000
Outstanding Balance
$91,755
Interest Rate
6.4%
Mortgage Type
Commercial
Estimated Equity
$214,947
Purchase Details
Closed on
Jul 19, 1993
Sold by
Viccione Victoria and Longwill Diane J
Bought by
Wilson Edward
Home Financials for this Owner
Home Financials are based on the most recent Mortgage that was taken out on this home.
Original Mortgage
$76,000
Interest Rate
7.4%
Mortgage Type
Commercial
Create a Home Valuation Report for This Property
The Home Valuation Report is an in-depth analysis detailing your home's value as well as a comparison with similar homes in the area
Home Values in the Area
Average Home Value in this Area
Purchase History
| Date | Buyer | Sale Price | Title Company |
|---|---|---|---|
| Communitiew People Inc | $180,000 | -- | |
| Wilson Edward | $80,000 | -- |
Source: Public Records
Mortgage History
| Date | Status | Borrower | Loan Amount |
|---|---|---|---|
| Open | Wilson Edward | $162,000 | |
| Previous Owner | Wilson Edward | $52,000 | |
| Previous Owner | Wilson Edward | $76,000 |
Source: Public Records
Map
Nearby Homes
Your Personal Tour Guide
Ask me questions while you tour the home.