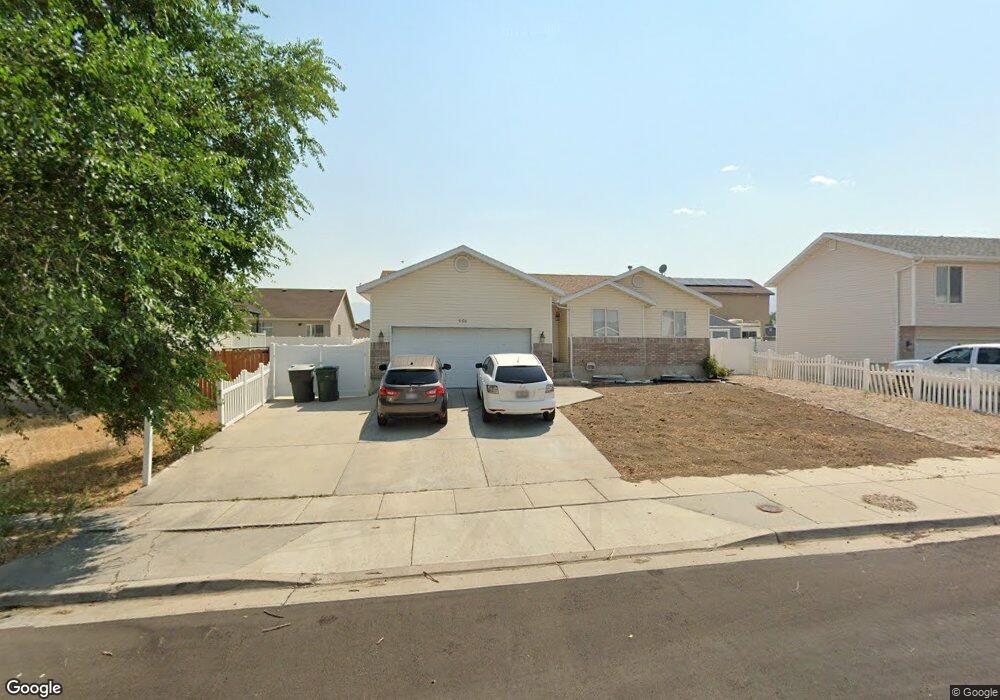
558 N 680 W Tooele, UT 84074
Estimated Value: $439,000 - $461,000
6
Beds
3
Baths
2,304
Sq Ft
$193/Sq Ft
Est. Value
About This Home
This home is located at 558 N 680 W, Tooele, UT 84074 and is currently estimated at $445,443, approximately $193 per square foot. 558 N 680 W is a home located in Tooele County with nearby schools including Northlake Elementary School, Tooele Junior High School, and Tooele High School.
Ownership History
Date
Name
Owned For
Owner Type
Purchase Details
Closed on
Jul 7, 2025
Sold by
Senga Lukomya and Senga Marie Walambo
Bought by
Mfuamba Rabbeca and Laurent Walambo
Current Estimated Value
Home Financials for this Owner
Home Financials are based on the most recent Mortgage that was taken out on this home.
Original Mortgage
$399,190
Interest Rate
6.72%
Mortgage Type
New Conventional
Purchase Details
Closed on
Dec 9, 2021
Sold by
Catt Christopher and Namanny Daccoda
Bought by
Lukomya Senga and Marie Walambo
Home Financials for this Owner
Home Financials are based on the most recent Mortgage that was taken out on this home.
Original Mortgage
$399,190
Interest Rate
3.14%
Mortgage Type
New Conventional
Purchase Details
Closed on
May 16, 2016
Sold by
Price David J and Price Elena C
Bought by
Catt Christopher and Namanny Daccoda
Home Financials for this Owner
Home Financials are based on the most recent Mortgage that was taken out on this home.
Original Mortgage
$181,550
Interest Rate
4.5%
Mortgage Type
FHA
Purchase Details
Closed on
Jun 21, 2013
Sold by
Price Elena C
Bought by
Price David J and Price Elena C
Purchase Details
Closed on
Oct 30, 2005
Sold by
Price David J
Bought by
Price Elena C
Create a Home Valuation Report for This Property
The Home Valuation Report is an in-depth analysis detailing your home's value as well as a comparison with similar homes in the area
Home Values in the Area
Average Home Value in this Area
Purchase History
| Date | Buyer | Sale Price | Title Company |
|---|---|---|---|
| Mfuamba Rabbeca | -- | Servicelink | |
| Lukomya Senga | -- | Novation Title Ins Agcy | |
| Catt Christopher | -- | Old Republic Title Clearliel | |
| Price David J | -- | None Available | |
| Price Elena C | -- | None Available |
Source: Public Records
Mortgage History
| Date | Status | Borrower | Loan Amount |
|---|---|---|---|
| Previous Owner | Mfuamba Rabbeca | $399,190 | |
| Previous Owner | Lukomya Senga | $399,190 | |
| Previous Owner | Catt Christopher | $181,550 |
Source: Public Records
Tax History Compared to Growth
Tax History
| Year | Tax Paid | Tax Assessment Tax Assessment Total Assessment is a certain percentage of the fair market value that is determined by local assessors to be the total taxable value of land and additions on the property. | Land | Improvement |
|---|---|---|---|---|
| 2025 | $2,669 | $404,775 | $97,500 | $307,275 |
| 2024 | $2,923 | $223,150 | $53,625 | $169,525 |
| 2023 | $2,923 | $244,899 | $51,076 | $193,823 |
| 2022 | $2,836 | $244,016 | $65,065 | $178,951 |
| 2021 | $2,270 | $163,372 | $20,144 | $143,228 |
| 2020 | $2,156 | $269,138 | $36,625 | $232,513 |
| 2019 | $2,020 | $248,000 | $36,625 | $211,375 |
| 2018 | $1,796 | $209,131 | $30,000 | $179,131 |
| 2017 | $1,452 | $200,601 | $30,000 | $170,601 |
| 2016 | $1,095 | $89,866 | $17,875 | $71,991 |
| 2015 | $1,095 | $79,628 | $0 | $0 |
| 2014 | -- | $79,628 | $0 | $0 |
Source: Public Records
Map
Nearby Homes
- 541 N Coleman St
- 605 N 640 W
- 614 N 640 W
- 605 Kay Ln
- 778 N 630 W
- 372 W 600 N Unit 42
- 792 N 630 W
- Snowbird Plan at Vista Meadows
- Sundance Plan at Vista Meadows
- Brighton Plan at Vista Meadows
- Solitude Plan at Vista Meadows
- 362 W 600 N Unit 43
- 831 Gleneagle Ct
- 352 W 600 N Unit 44
- 394 W 630 N Unit 8
- 377 W 630 St N Unit 22
- 462 W Sapphire Dr Unit 7016
- 451 W Sapphire Dr Unit 7035
- 683 Hidden River Trail W
- 826 Gleneagle Ct