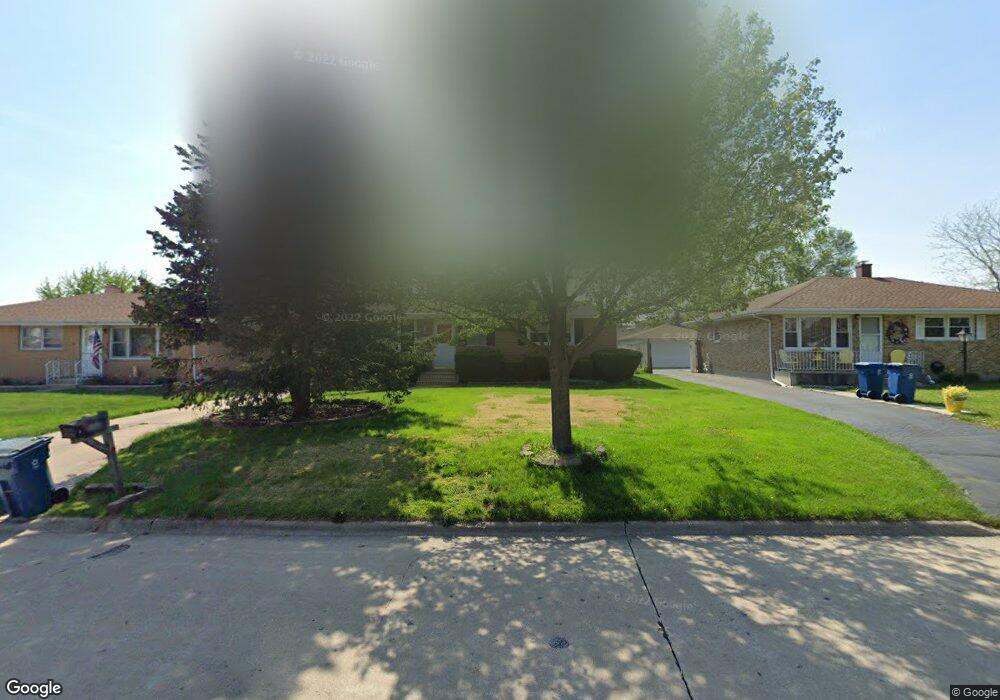
558 N Emroy Ave Elmhurst, IL 60126
Estimated Value: $423,959 - $516,000
3
Beds
2
Baths
1,275
Sq Ft
$374/Sq Ft
Est. Value
About This Home
This home is located at 558 N Emroy Ave, Elmhurst, IL 60126 and is currently estimated at $476,240, approximately $373 per square foot. 558 N Emroy Ave is a home located in DuPage County with nearby schools including Ruggles Elementary School, Field Elementary School, and Churchville Middle School.
Ownership History
Date
Name
Owned For
Owner Type
Purchase Details
Closed on
Nov 12, 2009
Sold by
Alund Dennis G and Alund Peggy M
Bought by
Lickton Tamar N and Buttacavaoli Albert J
Current Estimated Value
Home Financials for this Owner
Home Financials are based on the most recent Mortgage that was taken out on this home.
Original Mortgage
$292,500
Outstanding Balance
$190,012
Interest Rate
4.9%
Mortgage Type
New Conventional
Estimated Equity
$286,228
Purchase Details
Closed on
Feb 26, 1999
Sold by
Hohman Matthew C and Hohman Amy M
Bought by
Alund Dennis G and Alund Peggy M
Home Financials for this Owner
Home Financials are based on the most recent Mortgage that was taken out on this home.
Original Mortgage
$153,900
Interest Rate
10.5%
Purchase Details
Closed on
Oct 1, 1996
Sold by
Martin Dorothy E
Bought by
Hohman Matthew C and Hohman Amy M
Home Financials for this Owner
Home Financials are based on the most recent Mortgage that was taken out on this home.
Original Mortgage
$146,013
Interest Rate
8.23%
Mortgage Type
FHA
Create a Home Valuation Report for This Property
The Home Valuation Report is an in-depth analysis detailing your home's value as well as a comparison with similar homes in the area
Home Values in the Area
Average Home Value in this Area
Purchase History
| Date | Buyer | Sale Price | Title Company |
|---|---|---|---|
| Lickton Tamar N | $325,000 | Chicago Title Insurance Co | |
| Alund Dennis G | $172,000 | -- | |
| Hohman Matthew C | $148,500 | -- |
Source: Public Records
Mortgage History
| Date | Status | Borrower | Loan Amount |
|---|---|---|---|
| Open | Lickton Tamar N | $292,500 | |
| Previous Owner | Alund Dennis G | $153,900 | |
| Previous Owner | Hohman Matthew C | $146,013 |
Source: Public Records
Tax History Compared to Growth
Tax History
| Year | Tax Paid | Tax Assessment Tax Assessment Total Assessment is a certain percentage of the fair market value that is determined by local assessors to be the total taxable value of land and additions on the property. | Land | Improvement |
|---|---|---|---|---|
| 2024 | $7,089 | $123,759 | $53,694 | $70,065 |
| 2023 | $6,528 | $113,770 | $49,360 | $64,410 |
| 2022 | $6,175 | $106,800 | $46,330 | $60,470 |
| 2021 | $5,907 | $102,300 | $44,380 | $57,920 |
| 2020 | $5,553 | $97,990 | $42,510 | $55,480 |
| 2019 | $5,492 | $94,220 | $40,870 | $53,350 |
| 2018 | $4,787 | $82,440 | $38,920 | $43,520 |
| 2017 | $4,688 | $78,790 | $37,200 | $41,590 |
| 2016 | $4,480 | $72,750 | $34,350 | $38,400 |
| 2015 | $4,380 | $67,200 | $31,730 | $35,470 |
| 2014 | $4,503 | $63,840 | $30,800 | $33,040 |
| 2013 | $4,488 | $65,140 | $31,430 | $33,710 |
Source: Public Records
Map
Nearby Homes
- 564 N Adele St
- 634 N Kenilworth Ave
- 234 E Grantley Ave
- 260 E Grantley Ave
- 183 E Grantley Ave
- 728 N Parker St
- 738 N Parker St
- 791 N Adele St
- 758 N Kenilworth Ave
- 286 N Indiana St
- 309 N Clinton Ave
- 272 N Willow Rd
- 240 N Willow Rd
- 251 W Armitage Ave
- 456 N Elm Ave
- 262 N Addison Ave
- 260 N Addison Ave
- 258 N Addison Ave
- 256 N Addison Ave
- 841 N York St Unit 101
- 562 N Emroy Ave
- 554 N Emroy Ave
- 568 N Emroy Ave
- 546 N Emroy Ave
- 551 N Howard Ave
- 557 N Emroy Ave
- 553 N Emroy Ave
- 557 N Howard Ave
- 277 E Armitage Ave
- 572 N Emroy Ave
- 561 N Emroy Ave
- 547 N Howard Ave
- 561 N Howard Ave
- 547 N Emroy Ave
- 541 N Howard Ave
- 567 N Emroy Ave
- 565 N Howard Ave
- 543 N Emroy Ave
- 265 E Armitage Ave
- 576 N Emroy Ave